Download
1 / 36
360 likes | 523 Views
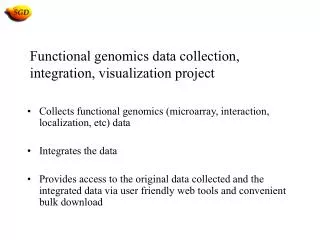
Capture, integration, and sharing of functional genomic data. Steve Oliver Professor of Genomics School of Biological Sciences University of Manchester http://www.cogeme.man.ac.uk http://www.bioinf.man.ac.uk. Complete organisms are much too complicated. Only very well understood

E N D
Capture, integration, and sharing offunctional genomic data Steve Oliver Professor of Genomics School of Biological Sciences University of Manchester http://www.cogeme.man.ac.uk http://www.bioinf.man.ac.uk
Complete organisms are much too complicated. Only very well understood systems have well defined pathways. Many biologists focus on one or a small number of genes. What are biologists interested in?
GENOME TRANSCRIPTOME PROTEOME METABOLOME
The nature of proteomics experiment data • Sample generation • Origin of sample • hypothesis, organism, environment, preparation, paper citations • Sample processing • Gels (1D/2D) and columns • images, gel type and ranges, band/spot coordinates • stationary and mobile phases, flow rate, temperature, fraction details • Mass Spectrometry • machine type, ion source, voltages • In Silico analysis • peak lists, database name + version, partial sequence, search parameters, search hits, accession numbers
A Systematic Approach to Modelling, Capturing and Disseminating Proteomics Experimental Data http://pedro.man.ac.uk/
The Framework Around PEDRo • Lab generated data is encoded using the PEDRo data entry tool, producing an XML (PEML) file for local storage, or submission • Locally stored PEML files may be viewed in a web browser (with XSLT), allowing web pages to be quickly generated from datasets • Upon receipt of a PEML file at the repository site, a validation tool checks the file before entering it into the database • The repository (a relational database) holds submitted data, allowing various analyses to be performed, or data to be extracted as a PEML file or another format
Why integrate data? “These 200 genes are up-regulated in my experiment. Are any of their protein products known to interact?” • Data is stored at a variety of sites and formats. • Databases designed mainly for browsing • (MIPS, SGD, BIND, SCPD, KEGG). • Need databases that allow complex queries. • Need to be easily usable by biologists.
Genome Information Management System (GIMS) Paton NW, Khan SA, Hayes A, Moussouni F, Brass A, Eilbeck K, Goble GA, Hubbard SJ, Oliver SG (2000) Conceptual modelling of genomic information. Bioinformatics 16, 548-557.
Integrates genomic and functional data. Consists of two parts: GIMS Database GIMS User Interface GIMS
GIMS Database GIMS data warehouse Browser Canned Queries Analysis Library SGD MIPS maxD
Database implementation • Uses the object database FastObjects. • All database classes and analysis programs are written in Java. • Allows close integration of the programming language with the database. • Allows fast access to database data from application programs. • Allows data to be stored in a way that reflects the underlying mechanisms in the organism. • Very flexible and extensible.
GIMS User Interface • Java application. • Can download from http://img.cs.man.ac.uk/gims • Communicates with database via RMI. • On start-up, application is sent information about database classes and canned queries. • Very flexible. • Allows user to browse database, ask canned queries, and store and combine data sets. • Can save results as txt, html or xml.
Selecting Canned Queries Query categories. Queries in selected category Initially empty store.
Parameterising a Query Previously selected query Parameters for specific run – selects down-regulated genes in the nucleus
Viewing the Results Result collection Operations on collections
Setting Its Parameters Parameters for specific run – selects down-regulated genes in the same experiment that are transcription factors
Inter-relating Results Collections selected for operating on Remove one result from the other
GIMS empowers the biologist
Literature relevant Annotations Data holdings Services that can use or produce this data Resources at the centre Workflows that could be used to generate this data People who have registered an interest in this data Related Data Provenance record on how the data was produced Ontologies describing data
People Provenance record of workflow runs they have made Literature Ontologies Notes Data holdings Preferences for Services Biologists at the centre Workflows they wrote or used People they collaborate with
myGrid • EPSRC UK e-Science pilot project. • Open Source Upper Middleware for Bioinformatics. • (Web) Service-based architecture -> Grid services. • 42 months, 24 months in. • Prototype v1 Release Sept 2004; some services available now. www.mygrid.org.uk
Annotation Pipeline What is known about my candidate gene? Medline EMBL GO Query OMIM BLAST DQP Workflows are in silico experiments
Application: Work bench demonstrator The myGrid service components are used in a demonstration application called the “myGrid WorkBench”, which provides a common point of use for the services. We can select data from the myGrid Information repository (mIR), select a workflow based on its semantic description, and examine the results.
e-Science: Provenance Like a bench experiment, myGrid records the materials and methods it has used for an in silico experiment in a provenance log. This is the where, what, when and how the experiment was run. Derivation paths ~ workflows, queries Annotations ~ notes Evolution paths ~ workflow workflow
e-Science: Notification A notification service can inform the mIR and the user (proxy) that data, workflows, services, etc. have changed and thus prompt actions over data in the mIR. Notifications are presented to the user with a client in the workbench environment. User registers interest in notification topics
The myGrid Team Matthew Addis, Nedim Alpdemir, Rich Cawley, Vijay Dialani, Alvaro Fernandes, Justin Ferris, Rob Gaizauskas, Kevin Glover, Carole Goble, Chris Greenhalgh, Mark Greenwood, Claire Jennings, Ananth Krishna, Xiaojian Liu, Darren Marvin, Karon Mee, Simon Miles, Luc Moreau, Juri Papay, Norman Paton, Simon Pearce, Steve Pettifer, Milena Radenkovic, Peter Rice, Angus Roberts, Alan Robinson, Martin Senger, Nick Sharman, Paul Watson, Anil Wipat and Chris Wroe.
Need GRID to empower the biologist