Download
1 / 55
550 likes | 627 Views
Highlights from the Program for the International Assessment of Adult Competencies (PIAAC ), 2012. Jack Buckley National Center for Education Statistics (NCES) Washington, DC October 2013. What is PIAAC?. I nternational large-scale assessment administered in 2011-12 in 23 countries

E N D
Highlights from the Program for the International Assessment of Adult Competencies (PIAAC), 2012 Jack Buckley National Center for Education Statistics (NCES) Washington, DC October 2013
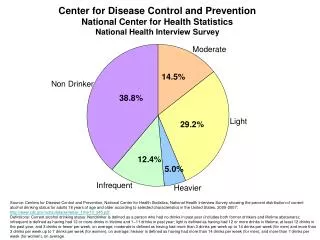
What is PIAAC? • International large-scale assessment administered in 2011-12 in 23countries • 16- to 65-year-olds, non-institutionalized, residing in the country, irrespective of nationality, citizenship, or language status • Laptop computer or paper-and-pencil: • In the U.S., 80% took the computer tests and 15% took the paper-and-pencil tests. • Assessment subjects: • Literacy, Numeracy, and Problem Solving in Technology-Rich Environments • Conducted in English in the U.S.: • Background survey in English or Spanish. About 4% could not complete the questionnaire because of language difficulties or learning or mental disabilities, and 1% could not complete it for other reasons.
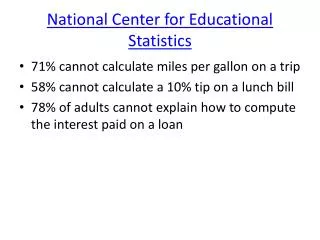
General patterns of U.S. results • Below international average in all subject areas • Ranked better in literacy than in numeracy or problem solving in technology-rich environments • Higher percentage at low proficiency levels than international average • Percentages of top performers similar to or slightly lower than international average, depending on the subject • Performance gap between young and older population smaller than the average gap internationally
What PIAAC reports Average Scores: Reported on a scale of 0-500 for all domains. Proficiency Levels: Reported as the percentages of adults scoring at six performance levels in literacy and numeracy and at four performance levels in problem solving in technology-rich environments.
Literacy proficiency levels Level 5 Level 4 Level 3 Level 2 Level 1 Below Level 1
Numeracy proficiency levels Level 5 Level 4 Level 3 Level 2 Level 1 Below Level 1
Problem solving in technology-rich environments proficiency levels Level 3 Level 2 Level 1 Below Level 1
Problem Solving in technology-rich environments example item
Problem Solving in technology-rich environments example item
U.S. average literacy score (270) lower than the international average (273) Lower than in 12 countries: Japan, Finland, Netherlands, Australia, Sweden, Norway, Estonia, Flanders-Belgium, Czech Republic, Slovak Republic, Canada, Republic of Korea Not significantly different than in 5 countries: England and Northern Ireland- U.K., Denmark, Germany, Austria, Cyprus Higher than in 5 countries: Poland, Ireland, France, Spain, Italy
Seven countries had higher percentages of adults reaching the highest proficiency level (4/5) in literacy Median Median Below level 1 range: 0-175 Level 1 range: 176-225 Level 2 range: 226-275 Level 3 range: 276-375 Level 4/5 range: 376-500
Higher proportion of U.S. adults at the bottom levels of literacy
U.S. 16- to 24-year-olds below international average in literacy, rank lower than 16- to 65-year-olds overall Lower than in 12 countries: Japan, Finland, Netherlands, Republic of Korea, Estonia, Flanders-Belgium, Australia, Sweden, Poland, Czech Republic, Germany, Austria Not significantly different than in 8 countries: Denmark, Slovak Republic, Canada, Norway, France, Ireland, Cyprus, England and Northern Ireland- U.K. Higher than in 2 countries: Spain, Italy
Only oldest U.S. adults outperformed the international average in literacy *p < .05. U.S. average score is significantly different from PIAAC international average.
Least educated adults below the international average in literacy *p < .05. U.S. average score is significantly different from PIAAC international average.
Employed adults in the U.S. had lower average literacy scores than their peers internationally *p < .05. U.S. average score is significantly different from PIAAC international average.
U.S. White adults had higher average literacy scores than either Black or Hispanic adults *p < .05. Average score is significantly different from White average.
U.S. gaps in literacy scores larger than international average by parental education and nativity status
In literacy, U.S. gaps larger by educational attainment and skill level of job, but similar to international average by income and employment status
U.S. gaps in literacy scores similar to international average by gender, smaller by age, and larger by health status
U.S. average literacy score in 2012 not significantly different from 2003, but lower than in 1994 *p < .05. Average score is significantly different from PIAAC.
Summary of literacy findings: • Lower overall literacy scores than international average • Higher percentage of low performers than international average • Gaps between less advantaged socio-economic groups and more advantaged peers higher in U.S. than internationally • No change in overall U.S. literacy scores since 2003
U.S. average numeracy score (253) lower than the international average (269) Lower than in 18 countries: Japan, Finland, Flanders-Belgium, Netherlands, Sweden, Norway, Denmark, Slovak Republic, Czech Republic, Austria, Estonia, Germany, Australia, Canada, Cyprus, Republic of Korea, England and Northern Ireland- U.K., Poland Not significantly different than in 2 countries: Ireland, France Higher than in 2 countries: Italy, Spain
Fifteen countries had higher percentages of adults reaching the highest proficiency level (4/5) in numeracy Median Below level 1 range: 0-175 Level 1 range: 176-225 Level 2 range: 226-275 Level 3 range: 276-375 Level 4/5 range: 376-500
Higher proportion of U.S. adults at the bottom levels of numeracy
U.S. 16- to 24-year-olds below international average in numeracy, rank lower than 16- to 65-year-olds overall Lower than in 21 countries: Netherlands, Finland, Japan, Flanders-Belgium, Republic of Korea, Austria, Estonia, Sweden, Czech Republic, Slovak Republic, Germany, Denmark, Norway, Australia, Poland, Canada, Cyprus, France, Ireland, England and Northern Ireland- U.K., Spain Not significantly different than in 1 country: Italy
U.S. adults in all age groups below international average in numeracy *p < .05. U.S. average score is significantly different from PIAAC international average.
U.S. adults at every education level below the international average in numeracy *p < .05. U.S. average score is significantly different from PIAAC international average.
Employed adults in the U.S. had lower average numeracy scores than their peers internationally *p < .05. U.S. average score is significantly different from PIAAC international average.
U.S. White adults had higher average numeracy scores than either Black or Hispanic adults *p < .05. Average score is significantly different from White average.
U.S. gaps in numeracy scores larger than international average by parental education, not different by nativity status
In numeracy, U.S. gaps larger by educational attainment, income, and skill level of job, but similar to international average by employment status
In numeracy, U.S. gap similar to international average by gender, smaller by age, and larger by health status
U.S. average numeracy score in 2012 lower than in 2003 *p < .05. Average score is significantly different from PIAAC.
Summary of numeracy findings: • Lower overall numeracy scores than international average • Higher percentages of low performers than international average • Regardless of educational level or gender, U.S. adults lower than international average • Lower U.S. numeracy scores than in 2003
U.S. average problem solving in technology-rich environments score (277) lower than the international average (283) Lower than in 14 countries: Japan, Finland, Australia, Sweden, Norway, Netherlands, Austria, Denmark, Czech Republic, Republic of Korea, Germany, Canada, Slovak Republic, Flanders-Belgium Not significantly different than in 4 countries: England and Northern Ireland- U.K., Estonia, Ireland, Poland
Eight countries had higher percentages reaching the highest proficiency level (3) in problem solving in technology-rich environments Median Below level 1 range: 0-240 Level 1 range: 241-290 Level 2 range: 291-340 Level 3 range: 341-500
Higher proportion of U.S. adults at the bottom levels of problem solving in technology-rich environments
U.S. 16- to 24-year-olds below international average in problem solving in technology-rich environments Lower than in 14 countries: Republic of Korea, Finland, Sweden, Netherlands, Japan, Flanders-Belgium, Czech Republic, Norway, Australia, Germany, Austria, Canada, Denmark, Estonia Not significantly different than in 4 countries: England and Northern Ireland- U.K., Slovak Republic, Poland, Ireland
Only oldest U.S. adults outperformed the international average in problem solving in technology-rich environments *p < .05. U.S. average scores are significantly different from PIAAC international average.
Least educated adults below the international average in problem solving in technology-rich environments *p < .05. U.S. average scores are significantly different from PIAAC international average.
Employed adults in the U.S. had lower average problem solving in technology-rich environments scores than their peers internationally *p < .05. U.S. average scores are significantly different from PIAAC international average.
U.S. White adults had higher average problem solving in technology-rich environmentsscores than either Black or Hispanic adults *p < .05. Average scores are significantly different from White average.
In problem solving in technology-rich environments, U.S. gaps similar to international average by educational attainment, income, employment status, and skill level of job