Download
1 / 51
510 likes | 671 Views
Global Credit Markets - Current Crisis and Outlook for Defaults and Distressed Debt . NYU Stern School of Business. Ed Altman. January 24, 2008 New York.

E N D
Global Credit Markets - Current Crisis and Outlook for Defaults and Distressed Debt NYU Stern School of Business Ed Altman January 24, 2008 New York
7,000+ experts help clients analyze financial statements, dissect complex accounting, finance or tax situations, and identify accounting irregularities
Council Member Biography Edward I. Altman is the Max L. Heine Professor of Finance at the New York University Stern School of Business. He is the Director of Research in Credit and Debt Markets at the NYU Salomon Center for the Study of Financial Institutions. Prior to serving in his present position, Professor Altman chaired the Stern School's MBA Program for 12 years. Dr. Altman has an international reputation as an expert on corporate bankruptcy, high yield bonds, distressed debt and credit risk analysis. In 2005, Prof. Altman was named one of the “100 Most Influential People in Finance” by the Treasury & Risk Management magazine. Professor Altman is one of the founders and an Executive Editor of the international publication, the Journal of Banking and Finance. Dr. Altman's primary areas of research include bankruptcy analysis and prediction, credit and lending policies, risk management and regulation in banking, corporate finance and capital markets.
Topics • A review of defaults, related values, and recoveries for 2007 • Forecasting 2008/2009 defaults • Leverage buyout financial analysis and earnings implications • The relevance of historical based models in today's market
About GLG Institute GLG Institute (GLGiSM) is a professional organization focused on educating business and investment professionals through in-person meetings. It is designed to revolutionize the professional education market by putting the power of programming into the hands of the GLG community. GLGi hosts hundreds of Seminars worldwide each year. GLGi clients receive two seats to all Seminars in all Practice Areas. GLGi’s website enables clients to: • Propose Seminar topics, agenda items and locations • View and RSVP to scheduled and proposed Seminars • Receive a daily briefing with new posts on your favorite tickers, subject areas and from trusted Council Members • Share Seminar details with colleagues or friends
Gerson Lehrman Group Contacts Andrew Gordon Senior Vice President Accounting & Financial Analysis (AFA) Gerson Lehrman Group 850 Third Avenue, 9th Floor New York, NY 10022 212-984-3693 agordon@glgroup.com Aaron Liberman Managing Director, Sales and Marketing Gerson Lehrman Group 850 Third Avenue, 9th Floor New York, NY 10022 212-984-3684 aliberman@glgroup.com Carly Pisarri Process Manager Gerson Lehrman Group 850 Third Avenue, 9th Floor New York, NY 10022 212-750-1435 cpisarri@glgroup.com
IMPORTANT GLG INSTITUTE DISCLAIMER – By making contact with this/these Council Members and participating in this event, you specifically acknowledge, understand and agree that you must not seek out material non-public or confidential information from Council Members. You understand and agree that the information and material provided by Council Members is provided for your own insight and educational purposes and may not be redistributed or displayed in any form without the prior written consent of Gerson Lehrman Group. You agree to keep the material provided by Council Members for this event and the business information of Gerson Lehrman Group, including information about Council Members, confidential until such information becomes known to the public generally and except to the extent that disclosure may be required by law, regulation or legal process. You must respect any agreements they may have and understand the Council Members may be constrained by obligations or agreements in their ability to consult on certain topics and answer certain questions. Please note that Council Members do not provide investment advice, nor do they provide professional opinions. Council Members who are lawyers do not provide legal advice and no attorney-client relationship is established from their participation in this project. You acknowledge and agree that Gerson Lehrman Group does not screen and is not responsible for the content of materials produced by Council Members. You understand and agree that you will not hold Council Members or Gerson Lehrman Group liable for the accuracy or completeness of the information provided to you by the Council Members. You acknowledge and agree that Gerson Lehrman Group shall have no liability whatsoever arising from your attendance at the event or the actions or omissions of Council Members including, but not limited to claims by third parties relating to the actions or omissions of Council Members, and you agree to release Gerson Lehrman Group from any and all claims for lost profits and liabilities that result from your participation in this event or the information provided by Council Members, regardless of whether or not such liability arises is based in tort, contract, strict liability or otherwise. You acknowledge and agree that Gerson Lehrman Group shall not be liable for any incidental, consequential, punitive or special damages, or any other indirect damages, even if advised of the possibility of such damages arising from your attendance at the event or use of the information provided at this event.
Current Conditions in Global Credit Markets A New Paradigm or The Great Credit Bubble? Dr. Edward Altman NYU Stern School of Business GLGi Seminar New York January 24, 2008
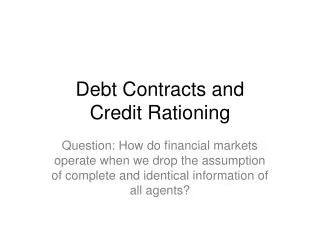
Changes in the Credit Environment:Are Historical Default and Recovery Estimates Still Relevant? Default and Recovery Forecasting Models • Macro-Economic Models: Default Probabilities • Mortality Rate Models: Default Probabilities • Recovery Rate Models: Loss-Given-Default • Distressed Debt Market Size Estimate
Factors Affecting the Transformation of Credit Markets in Last Few Years • Massive Global Liquidity • Petrodollars, Foreign Governments, Financial Institutions, Global Money Supply Expansion, etc. • Explosion of Hedge Fund Activity • Frenetic Activity in M&A/LBO transactions • Growth of the Institutional Loan Market, esp. Leveraged Loans • Easy Credit Standards by both Bank and Non-Bank Lenders • Record Low Required Yield Spreads in a Higher Credit Risk Profile Environment until September ‘07 • Third Quarter 2007 Spread Volatility
Factors Affecting the Transformation of Credit Markets in Last Few Years • Rapid Growth in Derivatives and Synthetics, esp. CDOs • Historically Low Default Rates and High Recoveries • Extremely Low Equity and Debt Volatility until Summer ‘07 • Escalating Leverage Throughout the Credit Markets in Search of Alpha • Recession in 2008/2009? • Hard Landing Default Rate • Soft Landing Default Rate
Are Historical Default and Recovery Estimates Still Relevant? Increased Creditor Influences and Lower Default Rates • Rescue Financing Restructurings (Privatization of Bankruptcy) • Pre-Petition Credit Facilities • Distressed Debt Control Investing • DIP Financings, Exit Financing
Size of the US High-Yield Bond Market 1978 – 2007 (Mid-year US$ billions)
Historical Default Rates Straight Bonds Only Excluding Defaulted Issues From Par Value Outstanding, 1971 – 2007 (US$ millions) Par Value Par Value Default Year Outstandinga Defaults Rates (%) 2006 $993,600 $7,559 0.761 2005 $1,073,000 $36,181 3.372 2004 $933,100 $11,657 1.249 2003 $856,000 $38,451 4.661 2002 $757,000 $96,855 12.795 2001 $649,000 $63,609 9.801 2000 $597,200 $30,295 5.073 1999 $567,400 $23,532 4.147 1998 $465,500 $7,464 1.603 1997 $335,400 $4,200 1.252 1996 $271,000 $3,336 1.231 1995 $240,000 $4,551 1.896 1994 $235,000 $3,418 1.454 1993 $206,907 $2,287 1.105 1992 $163,000 $5,545 3.402 1991 $183,600 $18,862 10.273 1990 $181,000 $18,354 10.140 1989 $189,258 $8,110 4.285 1988 $148,187 $3,944 2.662 1987 $129,557 $7,486 5.778 1986 $90,243 $3,156 3.497 1985 $58,088 $992 1.708 1984 $40,939 $344 0.840 1983 $27,492 $301 1.095 1982 $18,109 $577 3.186 b Weighted by par value of amount outstanding for each year. Source: Author’s compilation and Salomon Smith Barney Par Value Par Value Default Year Outstandinga Defaults Rates (%) 1981 $17,115 $27 0.158 1980 $14,935 $224 1.500 1979 $10,356 $20 0.193 1978 $8,946 $119 1.330 1977 $8,157 $381 4.671 1976 $7,735 $30 0.388 1975 $7,471 $204 2.731 1974 $10,894 $123 1.129 1973 $7,824 $49 0.626 1972 $6,928 $193 2.786 1971 $6,602 $82 1.242 Standard Deviation (%) Arithmetic Average Default Rate 1971 to 20073.096%3.061% 1978 to 20073.365%3.272% 1985 to 2007 4.029%3.435% Weighted Average Default Rateb 1971 to 2007 3.863% 1978 to 2007 3.874% 1985 to 2007 3.910% Median Annual Default Rate 1971 to 20071.708% 2007 $1075,400 $5,473 0.509%
Historical Default Rates QUARTERLY DEFAULT RATE AND FOUR QUARTER MOVING AVERAGE 1991 – 2007
Historical Default Rates and Recession Periods in the U.S. HIGH YIELD BOND MARKET 1972 – 2007 Periods of Recession: 11/73 - 3/75, 1/80 - 7/80, 7/81 - 11/82, 7/90 - 3/91, 4/01 – 12/01 Source: E. Altman (NYU Salomon Center) & National Bureau of Economic Research
Filings for Chapter 11 • Number of Filings and Pre-petition Liabilities of Public Companies • 1989 – 2007 2006 30 filings and liabilities of $23.2 billion 2007 38 filings and liabilities of $72.65 billion Note: Minimum $100 million in liabilitiesSource: NYU Salomon Center Bankruptcy Filings Database
New Issues Rated B- or Below as Percentage of all New Issues (1993 – 2007 Q3) Source: Standard & Poor’s Global Fixed Income Research
Purchase Price Multiples Purchase Price Multiple excluding Fees for LBO Transactions Source: Standard and Poor’s LCD
Leverage Continues to IncreaseCurrent European and U.S. Environments Average Total Debt Leverage Ratio for LBO’s: Europe and US with EBITDA of €/$50M or More Source: Standard & Poor’s LCD
Average Equity Contribution to Leveraged Buyouts 1987 – 4Q07 Equity includes common equity and preferred stock as well as holding company debt and seller note proceeds downstreamed to the operating company as common equity; Rollover Equity prior to 1996 is not available; There were too few deals in 1991 to form a meaningful sample. Source: Standard & Poor’s LCD
European Initial/Secondary Buyouts: Volume Annual Senior Loan Volume LBO Transaction Volume 2007 Total Funding from All Sources : €152.25B Deal Count: 152 2007: €55.66B Volume: €94.49 Deal Count: 51 2007: €96.62B 1H €70.7B * Deal Count counts First and Second Lien portions of a single transaction as one event; Deal Count also excludes any amendments. Reflects total sources of funding of initial or secondary buyout by a private equity firm (excludes recaps, refinancings, etc) Source: Standard & Poor’s LCD
Below Investment Grade Debt Maturity Schedule (U.S.) ($Bil.) • Includes Term Loans, Revolvers, and Other Loans; Assumes Revolvers are Fully Drawn. • Source: DealLogic, Fitch Ratings.
Default Rates and Lossesa 1978 – 2007 Par Value Par Value Outstandinga Of Default Default Weighted Price Weighted Default Year $MM)($MMs) Rate (%) After Default Coupon (%) Loss (%) 2007 $1,075,400 $5,473 0.51 $66.6 9.64 0.20 2006 $993,600 $7,559 0.76 $65.3 9.33 0.30 2005 $1,073,000 $36,181 3.37 $61.1 8.61 1.46 2004 $933,100 $11,657 1.25 $57.7 10.30 0.61 2003 $825,000$ 38,4514.66$45.5 9.55 2.76 2002 $757,000$96,85812.79 $25.39.3710.15 2001 $649,000 $63,609 9.80 $25.5 9.18 7.76 2000 $597,200 $30,248 5.06 $26.4 8.54 3.94 1999 $567,400 $23,532 4.15 $27.9 10.55 3.21 1998 $465,500 $7,464 1.60 $35.9 9.46 1.10 1997 $335,400 $4,200 1.25 $54.2 11.87 0.65 1996 $271,000 $3,336 1.23 $51.9 8.92 0.65 1995 $240,000 $4,551 1.90 $40.6 11.83 1.24 1994 $235,000 $3,418 1.45 $39.4 10.25 0.96 1993 $206,907 $2,287 1.11 $56.6 12.98 0.56 1992 $163,000 $5,545 3.40 $50.1 12.32 1.91 1991 $183,600 $18,862 10.27 $36.0 11.59 7.16 1990 $181,000 $18,354 10.14 $23.4 12.94 8.42 1989 $189,258 $8,110 4.29 $38.3 13.40 2.93 1988 $148,187 $3,944 2.66 $43.6 11.91 1.66 1987 $129,557 $7,486 5.78 $75.9 12.07 1.74 1986 $90,243 $3,156 3.50 $34.5 10.61 2.48 1985 $58,088 $992 1.71 $45.9 13.69 1.04 1984 $40,939 $344 0.84 $48.6 12.23 0.48 1983 $27,492 $301 1.09 $55.7 10.11 0.54 1982 $18,109 $577 3.19 $38.6 9.61 2.11 1981 $17,115 $27 0.16 $12.0 15.75 0.15 1980 $14,935 $224 1.50 $21.1 8.43 1.25 1979 $10,356 $20 0.19 $31.0 10.63 0.14 1978 $8,946 $119 1.33 $60.0 8.38 0.59 Arithmetic Average 1978-2007:3.37$45.1510.802.27 Weighted Average 1978-2007:3.822.64 a Excludes defaulted issues.Source: Authors’ compilations and various dealer price quotes.
Source: E. Altman, et. al., “The Link Between Default and Recovery Rates”, NYU Salomon Center, S-03-4.
Annual Returns Yields and Spreads on 10-Year Treasury (Treas) and High Yield (HY) Bonds 1978 – 2007 Return (%) Promised Yield (%)a Year HY Treas Spread HY Treas Spread 2007 1.83 9.77 (7.95) 9.69 4.03 5.66 200611.851.3710.477.82 4.70 3.11 20052.082.04 0.048.44 4.39 4.05 2004 10.794.87 5.92 7.35 4.21 3.14 2003 30.62 1.25 29.37 8.00 4.26 3.74 2002 (1.53) 14.66 (16.19) 12.383.828.56 20015.44 4.01 1.43 12.31 5.04 7.27 2000(5.68)14.45(20.13)14.56 5.129.44 1999 1.73 (8.41) 10.14 11.41 6.44 4.97 1998 4.04 12.77 (8.73) 10.04 4.65 5.39 1997 14.27 11.16 3.11 9.20 5.75 3.45 1996 11.24 0.04 11.20 9.58 6.42 3.16 1995 22.40 23.58 (1.18) 9.76 5.58 4.18 1994 (2.55) (8.29) 5.74 11.50 7.83 3.67 1993 18.33 12.08 6.25 9.08 5.80 3.28 1992 18.29 6.50 11.79 10.44 6.69 3.75 1991 43.23 17.18 26.05 12.56 6.70 5.86 1990 (8.46) 6.88 (15.34) 18.57 8.07 10.50 1989 1.98 16.72 (14.74) 15.17 7.93 7.24 1988 15.25 6.34 8.91 13.70 9.15 4.55 1987 4.57 (2.67) 7.24 13.89 8.83 5.06 1986 16.50 24.08 (7.58) 12.67 7.21 5.46 1985 26.08 31.54 (5.46) 13.50 8.99 4.51 1984 8.50 14.82 (6.32) 14.97 11.87 3.10 1983 21.80 2.23 19.57 15.74 10.70 5.04 1982 32.45 42.08 (9.63) 17.84 13.86 3.98 1981 7.56 0.48 7.08 15.97 12.08 3.89 1980 (1.00) (2.96) 1.96 13.46 10.23 3.23 1979 3.69 (0.86) 4.55 12.07 9.13 2.94 1978 7.57 (1.11) 8.68 10.92 8.11 2.81 Arithmetic Annual Average 1978-2007 10.76 8.55 2.21 12.09 7.25 4.83 Compound Annual Average 1978-2007 10.16 8.00 2.16 a End-of-year yields. Source: Citigroup’s High Yield Composite Index
YTM Spread Between High Yield Markets & 10 Year Treasury Notes June 1 – December 31, 2007
Distressed And Defaulted Debt as a Percentage of High Yield And Defaulted Debt Markets1990 – 2007 Public deals only. Source: Citigroup Estimates.
Estimated Face And Market Values Of Defaulted And Distressed Debt 2005-2007 ($billion)
Size Of The US Defaulted And Distressed Debt Market ($ Billions) 1990 – 2007
Defaulted Debt Indexes: Market-to-Face Value Ratios (1987 – 2007) Loans Median Market-to-Face value is 0.69 and Average Market-to-Face value is 0.68 Bonds Median Market-to-Face value is 0.46 and Average Market-to-Face value is 0.43 35 Source: Altman-NYU Salomon Center Defaulted Debt Indexes
U.S. Distressed Funds with European Offices European DistressedDebt Managers (Home Grown)
Investment Styles and Target Returns in Distressed Debt Investing
Forecasting Defaults and the Default Rate MODEL DRIVERS • Mortality Rate Estimates: 1971 - 2006 = f {bond rating, age, redemptions, defaults} • Historical New Issuance over last 10 years by credit quality • Bond-ratings • Z-score Bond-equivalent ratings New Defaults and Default Rate in 2006 • Estimate high yield market growth in 2007 New Defaults and Default Rate in 2007, 2008
Total value of defaulting debt in year (t) total value of the population at the start of the year (t) MMR(t) = Marginal and CumulativeMortality Rate Equation One can measure the cumulative mortality rate (CMR) over a specific time period (1,2,…, T years) by subtracting the product of the surviving populations of each of the previous years from one (1.0), that is, MMR = Marginal Mortality Rate CMR(t)= 1 - SR(t) , t = 1 here CMR (t) = Cumulative Mortality Rate in (t), SR (t) = Survival Rate in (t) , 1 - MMR (t)
Mortality Rate Concept(Illustrative Calculation) For BB Rated Issues Security Issued Year 1 Year 2 No. Amount Default Call SF Default Call SF 1 50 -- -- 5 -- -- 5 2 50 50 -- -- NE NE NE 3 100 -- 100 -- NE NE NE 4 100 -- -- -- 100 -- -- 5 150 -- -- -- -- -- 15 6 150 -- -- -- -- -- -- 7 200 -- -- 20 -- -- 20 8 200 -- -- -- -- 200 -- 9 250 -- -- -- -- -- -- 10 250 -- -- -- -- -- -- Total 1,500 50 100 25 100 200 40 Amount Start of 1,500 175 1,325 340 985 Period - - - = Year 1 Year 2 Marginal Mortality 50/1,500 = 3.3% 100/1,325 = 7.5% Rate 1 - (SR1 x SR2 ) = CMR2 Cumulative Rate 3.3% 1 - (96.7% x 92.5%) = 10.55% NE = No longer in existence SF = Sinking fund
Mortality Rates by Original Rating All Rated Corporate Bonds* 1971-2007 • *Rated by S&P at Issuance • Based on 1,990 issues • Source: Standard & Poor's (New York) and Author's Compilation