Download
1 / 32
330 likes | 598 Views
Cost Benefit Analysis. FRST 318-March 5, 2013. Winning Bid!. What is cost-Benefit Analysis?. Cost-Benefit analysis is used to evaluate public actions and decisions

E N D
Cost Benefit Analysis FRST 318-March 5, 2013
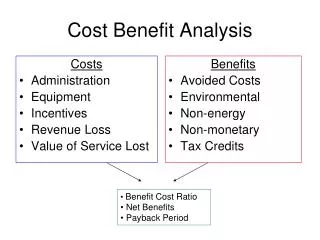
What is cost-Benefit Analysis? • Cost-Benefit analysis is used to evaluate public actions and decisions • Goal is to provide information on what action provides society with the most economically beneficial use of its resources (Loomis 1993 in Ward 2006) • Converts costs and benefits into a common denominator (most often money)
Application • Can evaluate introduction of regulation; or consideration of alternative instruments (tax, regulation); • programs-for example green transformation (what Mark mentioned); • projects • The analogy to the private sector-instead if revenues to a private firm, CBA substitutes benefits to society; and instead of private costs for the firm; CBA substitutes opportunity cost; and the equivalent of profit is benefit minus cost
Decision Rule • A simple decision rule-benefits must exceed costs • Comparing different actions with same goal, the one that provides the highest net benefit is the preferred action and should be adopted if economic efficiency is the goal • Other criteria • equity • administrative ease • Transparency • Predictability of implementation
Establishing assumptions and scope • Analysis should consider all those people and values affected • Goal is to capture all benefits and costs regardless of to whom they accrue • International not typically included unless these are meant to be specifically evaluated • Unless specifically restricted should span sectors and contingent costs • Benefits and costs should be measured with the program versus without it
Alternatives • Cost Effectiveness analysis • Where benefits difficult to measure or quantify or undesirable to do so (i.e. lives saved, endangered species) • Multi-criteria Analysis • Set of criteria against which policy options are evaluated • Environmental Impacts Assessment • Provides raw information, with no common value-some prefer because it does not assign values http://paperdarts.org/storage/1500-JoeUchill-High-school-popularity-A-costbenefit-analysis.png
Owls Versus Dollars The Policy Question • Should we reduce old growth logging to protect more spotted owl habitat? • Note that we could frame and answer this question in several ways, especially in regards to the prospects of seeing a species become extirpated
Selected Values • Timber • Carbon • Recreation • Non-timber forest products
Methodology • Three scenarios are established • Values are measured over a 100 year period and summed up • Sensitivity Analysis is used for the three most important variables • Timber prices, carbon prices, and discount rate • Timber harvest simulation model is used to calculate changes in forest growth, forest volume, and total timber stock
Scenarios • Maintaining Current Approach (SOMPcurr) • Specific area preserved can change so long as 67% of productive forest within long term activity centres is 100 years old • Preserving 100% of existing suitable stands are preserved (SUIT100) • Habitat is expanded (TERR100) • Packed territories are defined where contiguous areas of suitable habitat are not harvested
Measuring Timber Values • Measure producer surplus • Rely on market values for log prices and harvesting costs • The difference is producer surplus
Recreation Values 4.2.1 Consumer Surplus from Outdoor Recreation We measure the benefits to recreationists from the forests of the Fraser TSA as their consumer surplus (see Chapter 3). For recreation, consumer surplus is the difference between how much consumers value outdoor recreation and how much they spend on outdoor recreation. There are many different methods for estimating consumer surplus, the most common of which is the contingent valuation method. Consumers are asked how much they would be willing to pay in a hypothetical market for outdoor goods, such as wildlife habitat and provincial parks, over and above their expenditure on equipment, travel, and fees or licenses. There have not been any contingent valuation studies done for BC provincial forests in the last decade, so we use estimates from the Outdoor Recreation Survey 1989/90 to form an estimate of current willingness to pay. This survey covered recreation activities on provincial forests, which coincides with the area being analyzed in this report, the Fraser TSA.
Measured Values • Consumer surplus from outdoor recreation • Adjusting these values for forest harvesting • Hunting ($0.82 per ha) • Water-based and human-powered recreation activities ($59.70 per ha) • Angling • camping, • hiking, • backpacking • paddling, skiing and snowshoeing • hot springs • motorized activities • hunting
Measuring NTFP’s • Commercial Mushroom harvesting (producer surplus) ($1.27 per ha) • Recreational mushroom picking (consumer surplus from hiking plus market value) ($0.45 per ha) • Floral greenery and other NTFP’s (no value assigned)
Measuring Carbon Values • Two main carbon flows • Carbon sequestration and storage through net timber growth • Also carbon emissions from timber harvesting • Here only looked at decay of timber products • Did not look at changes in carbon content in the soil and understory biomass, carbon emissions during harvesting
Valuing Carbon • Pick three values to test sensitivity of results • $20, $75, and $150 • Assume different decay rates for timber products • 38% becomes construction lumber (5% loss 1st year, then approximately 1% thereafter) • 16.3% other type of lumber (40% 1st year, then approx. 1%) • 45.7% becomes chips (50% 1st year, then 9% for next 5 years) • So net value of Carbon for each scenario equals that sequestered over the period minus the losses
BREAKING DOWN THE COMPARISON In this scenario it does not make sense to reduce harvests; note that Baseline scenario has highest value
Answer • Yes, that we should reduce old growth logging • They find that the economic benefit of preserving more old growth (which leads to lower harvest levels) yields greater economic benefits • They do not attach any value to the spotted owl
Allowable Cut Effect (ACE) • The Allowable Cut Effect exists where there are regulations or policies that constrain harvest levels • Examples in BC are the metering out of old growth timber (key for it to work) • Improvements in growth and yield are spread out over the entire rotation • Conversely losses in timber are also spread out (regardless of whether or not timber was close to harvesting age)
EFFECT OF ACE Standard CBA Effect of ACE If you can take additional volume over the 58 years… ($13,187/58) Then it looks quite different Using a formula-the present value of a finite annuity Result with ACE Discounted benefit = ($13,187/58)*((1.05)58-1)/.05*(1.05)58 = $4,546 Same cost but NPV=$3,546 • Cost of improving the stand -$1000 per hectare • Result-doubling of growth (an additional 995 cubic metres) • Standard cost-benefit: • Discounted Benefit: $13,187/1.0558=$778 • Cost: $1000 • So NPV =-$222