Download
1 / 1
10 likes | 134 Views
A. 400 300 200 100 0. Control ATP ATP g S AMP ADP phosphate. *. **. Fast-growing microbes (CFU, 10 5 /g-compost). 0. 2. 6. B. Incubation time (day). 12 9 6 3 0. *. Control ATP ATP g S AMP ADP phosphate. *. Actinomycetes (CFU, 10 5 /g-compost). 0. 2. 6.

E N D
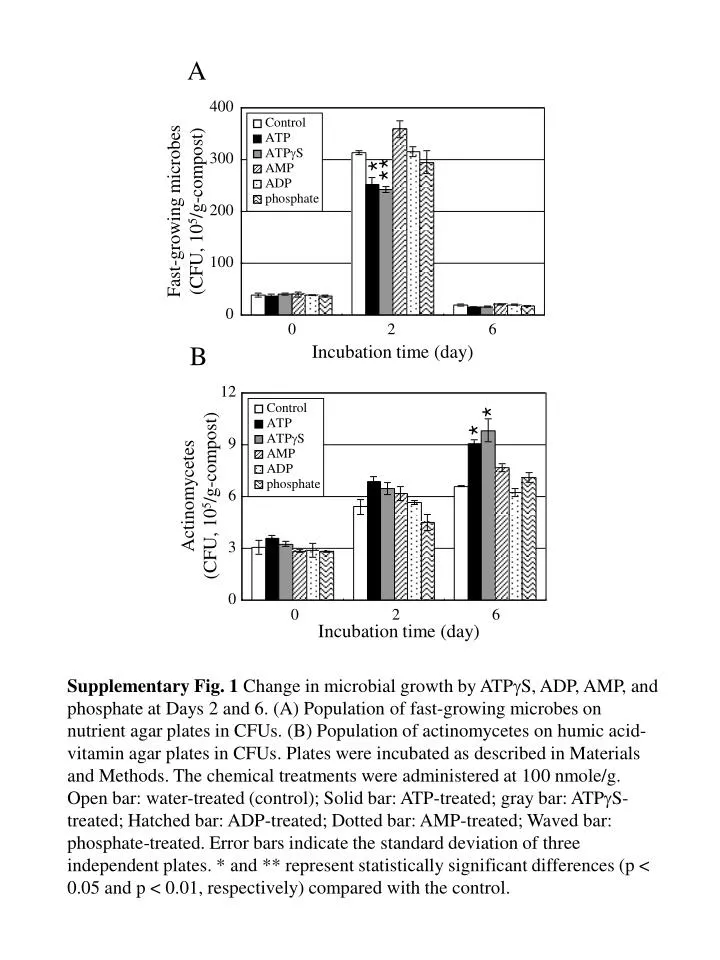
A 400 300 200 100 0 Control ATP ATPgS AMP ADP phosphate * ** Fast-growing microbes (CFU, 105/g-compost) 0 2 6 B Incubation time (day) 12 9 6 3 0 * Control ATP ATPgS AMP ADP phosphate * Actinomycetes (CFU, 105/g-compost) 0 2 6 Incubation time (day) Supplementary Fig. 1 Change in microbial growth by ATPgS, ADP, AMP, and phosphate at Days 2 and 6. (A) Populationof fast-growing microbes on nutrient agar plates in CFUs.(B) Populationof actinomycetes on humic acid- vitamin agar plates in CFUs. Plates were incubated as described in Materials and Methods. The chemical treatments were administered at 100nmole/g. Open bar: water-treated (control); Solid bar: ATP-treated; gray bar: ATPgS-treated; Hatched bar: ADP-treated; Dotted bar: AMP-treated; Waved bar: phosphate-treated. Error bars indicate the standard deviation of three independent plates. * and **represent statistically significant differences (p < 0.05 and p < 0.01, respectively) compared with the control.