Download
1 / 29
290 likes | 400 Views
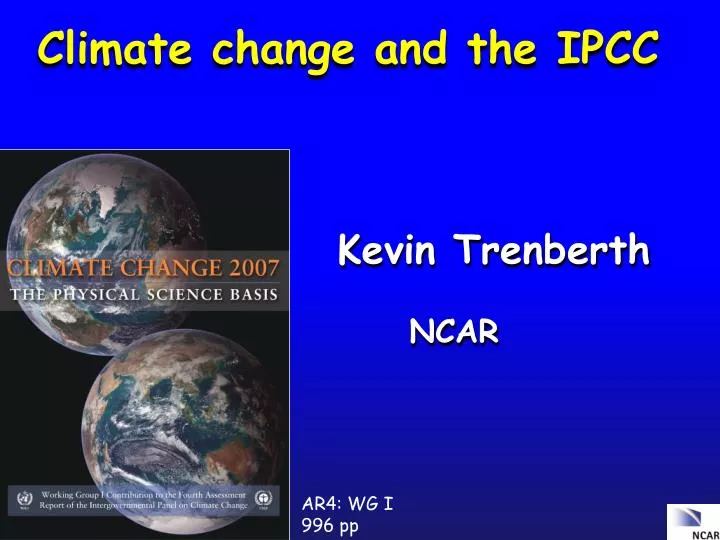
Climate change and the IPCC. Kevin Trenberth NCAR. AR4: WG I 996 pp. IPCC. 2007:

E N D
Climate change and the IPCC Kevin Trenberth NCAR AR4: WG I 996 pp
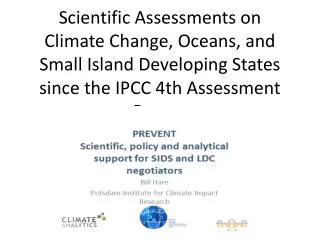
IPCC 2007: The Nobel Peace Prize goes to the Intergovernmental Panel on Climate Change (IPCC) and Albert Arnold (Al) Gore Jr. "for their efforts to build up and disseminate greater knowledge about man-made climate change, and to lay the foundations for the measures that are needed to counteract such change".
IPCC 1988 - The establishment of the IPCC Role of the IPCC: The role of the IPCC is toassesson a comprehensive, objective, open and transparent basis the scientific, technical and socio-economic information relevant to understanding the scientific basis of risk of human-induced climate change, its potential impacts and options for adaptation and mitigation. Review by experts and governments is an essential part of the IPCC process.
1988 - The establishment of the IPCC WMO, UNEP 1990 - First IPCC Assessment Report 1992 - IPCC Supplementary Reports 1994 - IPCC Special Report 1995 - Second IPCC Assessment Report 1996 - COP-2, 1997 - COP-3 2001 - Third IPCC Assessment Report 2002 - COP-8, 2003 - COP-9 2007 - Fourth IPCC Assessment Report 2009/12 - COP-15 Copenhagen IPCC 1992- Adoption of the UNFCCC 1994- Entry into force of the UNFCCC Ratified by 189 countries 1997- Adoption of Kyoto Protocol at COP-3 2005 Feb 16- Kyoto Protocol ratified by 164 countries (But not by USA or Australia)
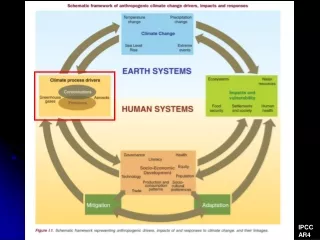
WGIII Mitigation Policy options Adaptation WGII Impacts IPCC Scenarios of future emissions of greenhouse gases, aerosols WGI Scenarios of future concentrations of greenhouse gases and aerosols Feedbacks Assessment of observations, processes and models WGI Projections of future climate: The response, global, regional
IPCC Scientific Assessment 2007 AR4 WG I: 11 Chapters 996 pages (vsTAR 882) 140 lead authors Hundreds contributors (66 Chapter 3) 2 or 3 Review editors for each chapter (26) Over 700 reviewers. Chapter 3: 2 CLAs, 10 LAs, 66 CAs 47 figures (126 panels), 8 Tables, 863 references, 102 pp. plus supplementary material 2231/ 1270 comments in scientific/governmental review 3501 total comments: all responded to in xls spread sheet (available publically)
IPCC Copenhagen December 2010 Representatives of 192 nations gathered in Copenhagen to seek a consensus on an international strategy for fighting global warming, in a series of meetings between Dec. 7 and Dec. 18, 2009. Leaders concluded a climate change deal which fell short of even the modest expectations for the summit. The accord drops what had been the expected goal of concluding a binding international treaty by the end of 2010, which leaves the implementation of its provisions uncertain. It is likely to undergo many months, perhaps years, of additional negotiation before it emerges in any internationally enforceable form.
IPCC • In late 2009: • Many emails were stolen from the University of East Anglia server involving Phil Jones. • Phil Jones and I were Coordinating Lead Authors on Chapter 3 of IPCC and so over 100 of the emails involved me. • Now known as “climategate” but really more like “swiftboating”, these emails have been used to damn the IPCC and many of us. There were several things in the emails that were obviously not for public consumption and violations of the freedom of information act were revealed. • None of mine were embarrassing to me at all, but one was highly misused and went viral. • Several enquiries have failed to reveal any issues with the science, and have exonerated Jones.
IPCC • In late 2009 (coinciding with Copenhagen) to 2010, malicious attacks have occurred on many who participated in the IPCC report, and the IPCC did not handle them well by defending its processes. • The report itself has been scrutinized along with all of the comments and responses to the comments. • Two minor errors have been found: both in WG II, none in WG I. • Himalayan glaciers melt (correct in WG I) • Area of Netherlands below sea level • None of all the attacks have in any way changed the science or the conclusions with regard to the climate change threats.
Running a fever:Seeing the doctor • Symptoms: the planet’s temperature and carbon dioxide are increasing • Diagnosis: human activities are causal • Prognosis: the outlook is for more warming at rates that can be disruptive and will cause strife • Treatment: mitigation (reduce emissions) and adaptation (plan for consequences)
Global temperatures and carbon dioxide through 2009 Base period 1961-90
2000-2005 (CERES Period) Trenberth et al 2009
TOA radiation does not change (much) in equilibrium Controls on the changes in net precipitation If the only change in climate is from increased GHGs: then SW does not change (until ice melts and if clouds change), and so OLR must end up the same. But downwelling and net LW increases and so other terms must change: mainly evaporative cooling. Transient response may differ from equilibrium (see Andrews et al. 09) Land responds faster. Radiative properties partly control rate of increase of precipitation.: Stephens and Ellis 2008 2000-2005 Trenberth et al 2009
Climate change and extreme weather events Changes in extremes matter most for society and human health With a warming climate: • More high temperatures, heat waves • Wild fires and other consequences • Fewer cold extremes. • More extremes in hydrological cycle: • Drought • Heavy rains, floods • Intense storms, hurricanes, tornadoes
Daily Precipitation at 2 stations Monthly Amount 75 mm Amount 75 mm A B Frequency 6.7% Intensity 37.5 mm Frequency 67% Intensity 3.75 mm drought wild fireslocal wilting plantsfloods soil moisture replenished virtually no runoff
Observations show that this is happening at the surface and in lower atmosphere: 0.55C since 1970 over global oceans and 4% more water vapor. This means more moisture available for storms and an enhanced greenhouse effect. Total water vapor Air holds more water vapor at higher temperatures A basic physical law tells us that the water holding capacity of the atmosphere goes up at about7% per degree Celsius increase in temperature. (4% per F)
How should precipitation P change as the climate changes? • With increased GHGs: increased surface heating evaporation E and P • With increased aerosols, E and P • Net global effect is small and complex • Warming and T means water vapor as observed • Because precipitation comes from storms gathering up available moisture, rain and snowintensity : widely observed • But this must reduce lifetime and frequency of storms • Longer dry spells Trenberth et al 2003
There is no trend in global precipitation amounts GPCP Global precipitation 1979-2008 Wentz 2007: 1987-2006 Biggest changes in absolute terms are in the tropics, and there is a strong El Niño signal.
Precipitation vs Temperature Winter high lats: air can’t hold moisture in cold; storms: warm and moist southerlies. Clausius-Clapeyron effect TP Nov-March Correlations of monthly mean anomalies of surface temperature and precipitation. May-September Negative: means hot and dry or cool and wet. Positive: hot and wet or cool and dry (as in El Nino region). Trenberth and Shea 2005 Tropics/summer land: hot and dry or cool and wet Rain and cloud cool and air condition the planet! PT Oceans: El Nino high SSTs produce rain, ocean forces atmosphere SSTP
Temperature vs Precipitation Cyclonic regime Cloudy: Less sun Rain: More soil moisture Surface energy: LH SH Rain Temperature Anticyclonic regime Sunny Dry: Less soil moisture Surface energy: LHSH Rain Temperature Summer: Land Strong negative correlations Does not apply to oceans
Supply of moisture over land is critical • Over land in summer and over tropical continents, the strong negative correlations between temperature and precipitation suggest factors other than C-C are critical: the supply of moisture. • There is a strong diurnal cycle(that is not well simulated by most models). • In these regimes, convectionplays a dominant role • Recyclingis more important in summer and advection of moisture from afar is less likely to occur. • Monsoonsplay a key role where active. • Given the right synoptic situation and diurnal cycle, severe convectionandintense rainscan occur.
Precipitation Observed trends (%) per decade for 1951–2003 contribution to total annual from very wet days > 95th %ile. Alexander et al 2006 IPCC AR4 Heavy precipitation days are increasing even in places where precipitation is decreasing.
Drought is increasing most places Mainly decrease in rain over land in tropics and subtropics, but enhanced by increased atmospheric demand with warming The most important spatial pattern (top) of the monthly Palmer Drought Severity Index (PDSI) for 1900 to 2002. The time series (below) accounts for most of the trend in PDSI. AR4 IPCC
“Rich get richer, poor get poorer” Projections: Combined effects of increased precipitation intensity and more dry days contribute to lower soil moisture 2090-2100 IPCC
Global warming effects from humans are already identifiable • Rising sea level: coastal storm surges, salt water intrusions, flooding • Heavier rains, floods: water contamination, water quality • Drought: water shortages, agriculture, water quality • Heat-waves: wildfires • Stronger storms, hurricanes, tornadoes: damage, loss of life, loss of habitat • Changes in climate: crops, famine, discontent and strife, more insects (range, seasons), fungal and other disease; vector-borne disease. • Sea ice loss: habitat loss • Permafrost melting: infrastructure at risk
Water servesas the “air conditioner” of the planet. Rising greenhouse gases are causing climate change, semi-arid areas are becoming drier while wet areas are becoming wetter. Increases in extremes (floods and droughts) are already here. Water management:- dealing with how to save in times of excess for times of drought – will be a major challenge in the future. Lake Powell