Download
1 / 34
340 likes | 497 Views
Robust diagnosis DLBCL from gene expression data from different laboratories. Gyan Bhanot, IBM Research. Dimacs Workshop, June 22, 2005. Collaborators: Gabriela Alexe 1 Arnold Levine 2,3 Gustavo Stolovitzky 1. 1 IBM 2 IAS 3 UMDNJ. Overview. Motivation

E N D
Robust diagnosis DLBCL from gene expression data from different laboratories Gyan Bhanot, IBM Research Dimacs Workshop, June 22, 2005
Collaborators: Gabriela Alexe1 Arnold Levine2,3 Gustavo Stolovitzky1 1 IBM 2 IAS 3 UMDNJ
Overview • Motivation • Pattern-based meta-classifiers • Case study – compare data from two labs for DLBCL vs FL diagnosis
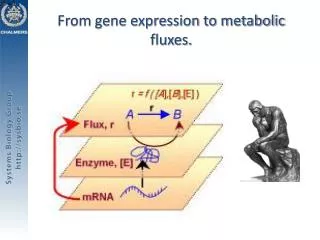
Motivation Cancer is a genetic/proteomic disease • Genetic mutations/virus’s/radiation modify pathways to create survival advantage for damaged cell • Gene Arrays are a way to study the variation of mRNA levels between diseased and healthy cells. • This allows diagnosis and inference of pathways that cause disease
Cancer diagnosis: Input Training (biomedical / proteomic, microarray) data: k 2 classes (m samples) described by N >> features Output Collection of robust biomarkers, models Robust, accurate classifier / tested on out-of-sample data
Strategy of present paper 1. Transform original data to “pattern ” space 2. Find robust sets of biomarkers with significant collective discriminatory power 3. Use many machine learning tools on original and pattern data ANN, SVM, kNN, Weighted voting, Classification trees 4. Validate the results on data from a different lab
Patterns Observed dataset System response
Pattern basics Positive patterns Negative patterns
Individual classifiers used SVM, ANN, WV, KNN, CART, LR Trained / calibrated (leave-one-out): raw data pattern data
Application: Progression of Follicular Lymphoma (FL) to Diffuse Large B Cell Lymphoma (DLBCL) Gene Array data from different laboratories Shipp et al. (2002) Nature Med.; 8(1), 68-74. (Whitehead Lab) Stolovitzky G. (2005) In Deisboeck et al Complex Systems Science in BioMedicine (in press) (preprint: http://www.wkap.nl/prod/a/Stolovitzky.pdf). (DellaFavera Lab) Alexe et al (2005) Artificial Intelligence in Medicine (in press)
Non-Hodgkin lymphomas FL low grade non-Hodgkin lymphoma t(14;18) translocation: over-expression of anti-apoptotic bcl2 25-60% FL cases evolve to DLBCL DLBCL high grade non-Hodgkin lymphoma < 2 years survival if untreated Biomarkers: FL transformation to DLBCL • p53/MDM2 (Moller et al., 1999) • p16 (Pyniol, 1998) • p38MAPK (Elenitoba-Johnson et al., 2003) • c-myc (Lossos et al., 2002)
Lymphoma datasets Data:WI (Shipp et al., 2002) Affy HuGeneFL CU (DallaFavera Lab, Stolovitzky, 2005) Affy Hu95Av2 Samples: WI: 58 DLBCL & 19 FL CU: 14 DLBCL & 7 FL Genes: WI: 6817 CU: 12581
Data Preprocessing • 50 % P calls, UL = 16000, LL = 20 • 2/1 stratify WI data to train/test. CU data test • Compute SD per gene across samples • Normalize data to mean 0, SD 1 per gene • Generate 500 data sets using noise + k fold stratified sampling + jacknife • Find genes with high correlation to phenotype using t-test or SNR. Keep genes that are in > 450/501 of datasets
Choosing Support Sets • Create good patterns using small subsets of genes, validate using weighted voting with 10 fold cross validation • Sort genes by their appearance in good patterns • Select top genes to cover each sample by at least 10 patterns
Examples of FL and DLBCL patterns WI training data: Each DLBCL case satisfies at least one of the patterns P1 and P2 Each FL case satisfies the pattern N1 (and none of the patterns P1 and P2)
FL DLBCL progression p53 related genes identified by filtering procedure
Examples of p53 responsive genes patterns WI data: Each DLBCL case satisfies one of the patterns P1, P2, P3 Each FL case satisfies one of the patterns N1, N2, N3
p53 combinatorial biomarker 77% FL & 21% DLBCL cases (3.7 fold) at most one gene over-expressed 79% DLBCL & 23% FL cases (3.4 fold) at least two genes over-expressed Each individual gene: over- expressed in about 40-70% DLBCL & 20-40% FL (specificity 50-60%, sensitivity 60-70%)
What are these genes? • Plk1 (stpk13): polo-like kinase serine threonine protein kinase 13, M-phase specific • cell transformation, neoplastic, drives quiescent cells into mitosis • over-expressed in various human tumors • Takai et al., Oncogene, 2005: plk1 potential target for cancer therapy, new prognostic marker for cancer • Mito et al, Leuk Lymph, 2005: plk1 biomarker for DLBCL • Cdk2 (p33): cyclin -dependent kinase: G2/M transition of mitotic cell cycle, interacts with cyclins A, B3, D, E • P53 tumor suppressor gene (Levine 1982)
Conclusions • Pattern-based meta-classifier is robust against noise • Good prediction of FL DLBCL • Biology Based Analysis also possible • Yields useful Biomarker • Should Study Biologically motivated sets of genes build pathways
<> Thank you for your attention !
Support vector machines Find a maximum margin hyperplane in pattern space (Vapnik) (P) (D)
k-Nearest neighbors • Training data : samples in normalized peptide space • Prediction for test data: The dominant class of the k-nearest neighbors in Euclidean metric Positive New case: Negative Negative
Weighted voting Pattern data: • each pattern P is a voter • weight = fraction of correctly classified cases by the pattern • each test case: compute sum of weights of triggered positive patterns and negative patterns • classify by highest weight
Logistic regression • Dataset of two phenotypes (e.g., cancer vs. non-cancer) • Transform into logit space y->ln(p/1-p) • Find phenotype predictor as a linear combination of data values in logit space Insightful Miner
Decision trees / forests • Find rules in training data: • find root feature which best classifies samples by phenotype • iterate on each branch to find two new features which best split each branch by phenotype • if necessary prune weak support nodes • CART =Classification and Regression Trees (Breiman) • Many trees = forest