Download
1 / 19
190 likes | 323 Views
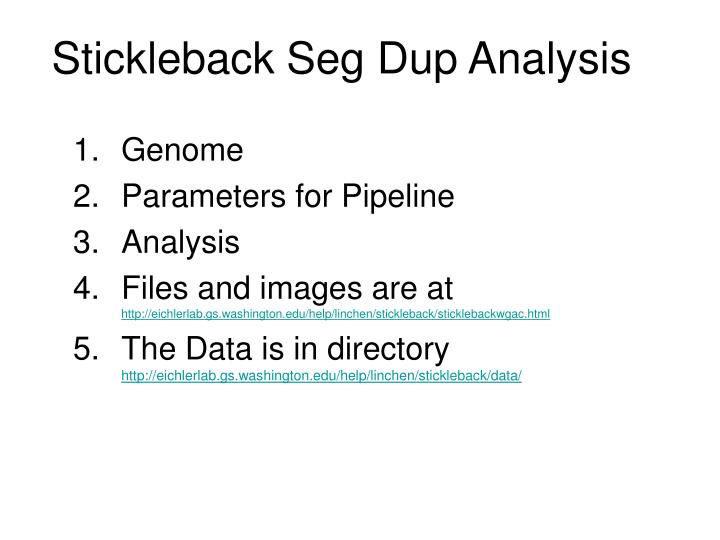
Stickleback Seg Dup Analysis. Genome Parameters for Pipeline Analysis Files and images are at http://eichlerlab.gs.washington.edu/help/linchen/stickleback/sticklebackwgac.html The Data is in directory http://eichlerlab.gs.washington.edu/help/linchen/stickleback/data/. Stickleback Genome.

E N D
Stickleback Seg Dup Analysis Genome Parameters for Pipeline Analysis Files and images are at http://eichlerlab.gs.washington.edu/help/linchen/stickleback/sticklebackwgac.html The Data is in directory http://eichlerlab.gs.washington.edu/help/linchen/stickleback/data/
Stickleback Genome • The Genome(v1.0) is down loaded from UCSU. • Total Length is 463,354,448bp which contains a chrUn of 62,550,211bp • Total of 29101 gene annotations from ensemble gene annotation were down loaded from UCSC.
Seg Dup detection pipelines • WGAC to detect Seg Dup in genomic assembly by looking for homology pairs. ( >1kb in length >90% identity) • WSSD to detect Seg Dup in given sequences based on depth coverage of WGS (whole Genome shot gun reads). Depth coverage > Average + 3SD.
Parameters and Notes for WGAC pipeline • Repeats • Standard repeat coordinated were reverse generated from the soft mask data. • The secondary repeat masker were done using two repeat libraries, the ab_initio_lib.txt and supplemental_lib.txt. • Repeat Mask result for all three libraries were combined and sorted, then used for both pipelines • Blast parsing seeds in WGAC pipeline: • the seed size is 500bp
Result from WGAC Pipeline • Total pairs of SD detected(>1kb and >90% identity) 152272 • Inter chromosome pairs 63744 • Intra chromosome pairs 88528 • chrUn intra 81641 • chrUn inter and intra 123278 • Total NR 40,573,574bp Notes: • In general, the number of WGAC pairs is too high (10%) for stickleback genome with only 400mb. • 92% of total intra chromosomal WGAC pairs and 81% total pairs has at least one sequence in the pair is on chrUn. The result is expected, since chrUn contains high percentage of redundant poorly assembled sequences. • Our analysis also suggest that the potential repeats which are not covered by the repeat libraries, may also detected as WGAC pairs. Next slid.
Repeats? • Since the repeats might be an issue, I set up a filter to determine how many of WGACs may be affected. If I use >20hit, 400bp on boundary, hit length <10kb, it affected 30% of WAC pairs. If I use >10hit, and 400bp bound overlap, and hit < 10kb, 60% of WGAC is affected. • I then generate the nr space of these hit. They are total of 7,481,640bp from 103, 157 pairs in total WGAC (152, 272 pairs of total 40,473,574bp). It has 2/3 of hits, but only 1/5 of total nr space. • I think it is very reasonable. Because the high proportion of the WGAC pairs only affect a small proportion of NR space. • These sequence intervals should also be detected by WSSD if they are the repeats. • However, I did not take them out from Alldup(which is a merge of WGAC and WSSD) yet, because many of them has high frequency hit on chrUn. At this stage we do not know if they are the redundant sequences or the real seg dup. But we can pull them out at any time based on the coordinates. • If I use >20hit, 400bp on boundary, hit length <10kb, 30% of WGAC can be
General analysis of WGAC length and identity distribution • Length distribution peaked at < 3kb, intra > inter, with 92% of intra on chrUn. • Identity distribution peaked at 96%. Few is high than 99%.
General analysis, NR distribution on chromosome.high SD in chrUn
General view which show all WGAC on all chromosome Concentration of SD on smaller supercontigs on chrUn
Global image shows the inter and intra pairs of 5kb and above 90% without the chrUn. The red indicates the inter chromosomal pairs and blue indicates intra chromosomal pairs
Global image shows the inter and intra pairs of 10kb and 90% without chrUn. The red indicates the inter chromosomal pairs and blue indicates intra chromosomal pairs
Global image shows the inter and intra pairs of WGAC with10kb and 90%. ChrUn is also included. The red indicates the inter chromosomal pairs and blue indicates intra chromosomal pairs chrUn
WSSD analysis • Down load the WGS reads about 6 million. • Down load Stickleback finished BAC. These BACs are used to determine the threshold for WGS depth coverage. For 5k window, the average number of reads is 78, with SD 27. The threshold for 5k window is 125. for 1k window is 25. (Average+3SD) • Repeat mask of the stickleback genome. I used the standard, ab_initio_lib.txt and supplemental_lib.txt. In addition I added the potential repeats I detected in WGAC process which shows more than 20 hit pairs the same region.
WSSD resulthttp://eichlerlab.gs.washington.edu/help/linchen/stickleback/data/wssd/ • There are total of 729 regions with 22,324,144bp were found in wssdGE10K_nogap.tab ( which has a 10k cut off), 251 of them are on chrUn. • 850 regions in wssd.tab with 23,116,317 total base. It has 125 more regions and less than 1mb extra sequences comparing to 10k hits. • A summary table of WGAC intersect with WSSD is at http://eichlerlab.gs.washington.edu/help/linchen/stickleback/data/wgacCMPwssd.xls
Union of WSSD and WGAC Gene intersect with Seg Dups • First a none redundant Union of WGAC and WSSD is generated. AllDup.tab • A list of genes intersect with the AllDup is performed to identify genes overlap with Dup space in genome. There are 3135 ensemble genes identified. • Both data sets are at http://eichlerlab.gs.washington.edu/help/linchen/stickleback/data/
The general view of WGAC and WSSD on chromosome Wssd black above chrom line WGAC 5k94% black below chrom line WGAC 10k brown below chrom line
Summary • Stickleback Seg Dup has been detected using two independent pipelines WGAC and WSSD. Since each pipeline is based on its unique mechanism, we expect majority of the interval should be consistent with some variation. From the result of two pipeline, two set of genomic intervals were generated for Seg Dup. • The first set consists of the genomic intervals detected by WGAC and WSSD, which is the intersect interval between WGAC and WSSD. This set represents the most conservative estimate of SEG DUPs in Genome. http://eichlerlab.gs.washington.edu/help/linchen/stickleback/data/wssd_wgac_intersect • The second set is a union of the interval of WAGC and WSSD (AllDup.tab), which represent the largest estimate of the SEG DUP in the genome. http://eichlerlab.gs.washington.edu/help/linchen/stickleback/data/allDup.tab • A list of genes intersecting with each set were also generated. • With AllDUp, union of WGAC and WSSD. There are total 3153 genes. http://eichlerlab.gs.washington.edu/help/linchen/stickleback/data/gene_in_alldup • With Dup from WGAC and WSSD intersect. There are total 1267 genes. http://eichlerlab.gs.washington.edu/help/linchen/stickleback/data/gene_in_wssd_wgac_intersect • A list of interval with potential to be repeats is also generated. They are the region with high frequency of hit with defined the boundary ( >10hits, <400bp at bound, <10kb in length). They account for >60% of total WAGC pairs and 1/5 of WGAC NR intervals. http://eichlerlab.gs.washington.edu/help/linchen/stickleback/data/repeathitMerge • ChrUn contigs contribute great deal to the total SD in both WGAC and WSSD. The identity distribution analysis shows that the identity of pairs are less than 99%, suggest they may contain true SD which are hard to assemble. But how many of them remain to be determined.