Download
1 / 13
130 likes | 324 Views
Some lessons from schools surveys in Indonesia and Papua New Guinea. Deon Filmer Development Research Group The World Bank Service Delivery Conference March 28, 2006. Two different sets of surveys. Indonesia: December 1998: Early days of economic crisis … were schools feeling any impact

E N D
Some lessons from schools surveys in Indonesia and Papua New Guinea Deon Filmer Development Research Group The World Bank Service Delivery Conference March 28, 2006
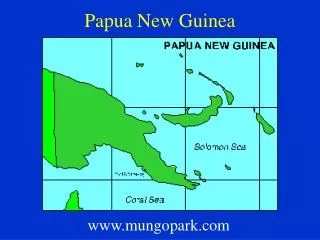
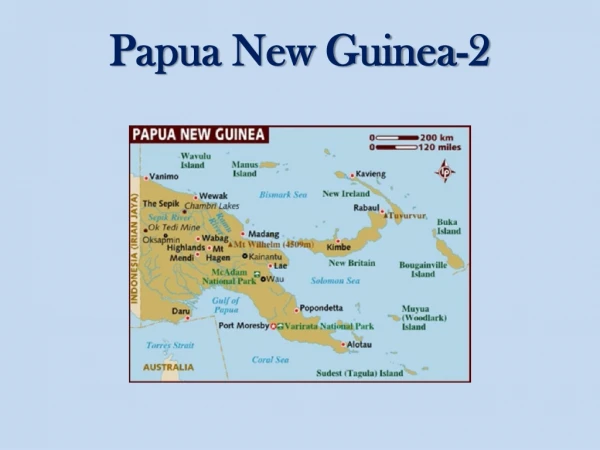
Two different sets of surveys • Indonesia: • December 1998: Early days of economic crisis … were schools feeling any impact • April/May 2000: Longer-run school-level impacts of the crisis, decentralization looming • PNG • April/May 2002: little knowledge about the status of services in PNG; particular interest in decentralization; explicit concern about expenditure tracking
Two different sets of surveys • Indonesia: • 600 schools • 5 purposively selected provinces • 15 districts (40 schools per district) • PNG • 220 schools • 8 purposively selected provinces • 2 districts (10 schools per district)
Activity structure • Indonesia: • Close collaboration with research department of ministry of education. • Ministry staff served as full partners in pilot/questionnaire development; served as regional survey supervisors. • Gave the survey some legs within the ministry, enabled substantially lower costs … but cost in terms of capacity and experience. • Study conceived of as stand alone survey, with Ministry/policymakers as primary audience. • PNG: • Partners with National Research Institute, an independent agency • Overseen by “working group” with various government, NGO, and other representatives. • Little hands on input from Ministry of Education. • Study conceived of as a part of WB Poverty Assessment.
What worked well • Indonesia • Trends in enrollments at the school level • Non-conventional wisdom result that enrollment impacts were mainly urban and at the secondary level; and in non-private/non-secular schools. • But difficulty: enrollment levels/trends … not enrollment rates. • Perceptions of impact of crisis • Identified “general impact” and “school functioning” as two main impacts (exploratory PC analysis) • Status of crisis-relief government programs (scholarship and grant programs) • Schools grants: Coverage; use; interesting substitution between grants and other sources of government (especially local government) sources of funding • Scholarships: Coverage (among students) • Trends in charging of fees • PNG • Descriptive status of schools (very little prior information) • Good documentation of delays in subsidies / teacher pay • Reasonable assessment of teacher absenteeism (pre-announced window for visit) • Good data to construct “ghost teacher” estimate (with substantial effort in matching to government payroll records)
Sources of school funding by grant receipt and public/private status: Indonesia 2000 Primary schools Junior Secondary schools
Delay in ability to use subsidy: PNG 2001 Percent who received any subsidy Weeks delay Note: Q1,Q3=National, Q2,Q4=Provincial
What was harder • Indonesia: • Trends in overall school incomes—never clear we had full picture (what we did have was worrisome, especially for private schools) • But, incredibly complicated system … is this worth doing when the system is so complex? • PNG: • Complex funding system … but able to track some specific payments (school subsidies) • But … school financial data very spotty • only about half of the schools had documentation about spending, half about receipts • Only 30% of schools had both expenditures and receipts documentation
Funding education in PNG2001, million Kina Q1,3 Q2,4 Source: Based on information collected during the PESD 2002 survey.
What I would think twice about doing again • Enrollment trends (unless have information on universe of schools and on population trends by area) • Hard (time consuming) to collect, hard to interpret • Too many instruments • PNG had 9 instruments, 7 at the school level. • Non-representative/random sample of parents
Survey instruments in PNG: • School (head teacher); • teacher roster; • select teachers; • data appendix; • grade 5 teacher; • board of management member; • parent; • District Education Advisor; • Provincial Education advisor.
I would think (very) hard about what financial data to collect • The more specific the better • But even there, school officials often don’t associate specific transfers to “official” name • Anything more than tracking a clearly defined transfer is very hard. Even that is hard: • missing information at schools; • missing records at provincial level; • defining the “base” • Official declarations in Government Circulars • Budget disbursements • School level expectations
What I would never do again • Data entry using a package not designed for that purpose • (Data entry using a package not designed for that purpose) • Sophisticated survey/tracking exercise in a LICUS country