Download

1 / 14
160 likes | 438 Views
Breakeven Analysis. Break-even analysis entails the calculation and examination of the margin of safety for an entity based on the revenues collected and associated costs.

E N D
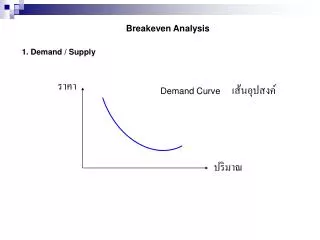
Break-even analysis entails the calculation and examination of the margin of safety for an entity based on the revenues collected and associated costs. • Analyzing different price levels relating to various levels of demand, an entity uses break-even analysis to determine what level of sales are needed to cover total fixed costs. A demand-side analysis would give a seller greater insight regarding selling capabilities.
What is the 'Breakeven Point - BEP' The breakeven point is the pricelevel at which the market price of a security is equal to the original cost.
Contribution Margin • The concept of break-even analysis deals with the contribution margin of a product. • The contribution margin is the excess between the selling price of the good and total variable costs. For example, • If a product sells for Rs.100, total fixed costs are Rs.25 per product and total variable costs are Rs.60 per product, the product has a contribution margin of the product is Rs.40 ($100 - $60). This Rs.40 reflects the amount of revenue collected to cover fixed costs and be retained as net profit. • Fixed costs are not considered in calculating the contribution margin.
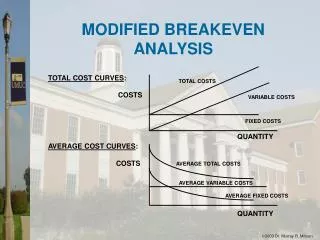
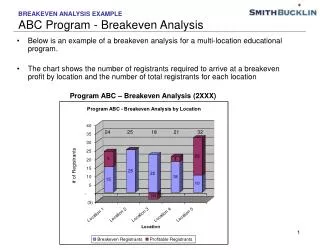
GRAPHIC METHOD OF BREAK EVEN ANALYSIS OR BREAK EVEN CHART • The Break even chart portrays a pictorial view of the relationships between costs, Volume, and profits. It shows the break even point and also indicates the estimated profit or loss at various level of output.
Break Even Analysis in Excel: 1: Create tables for recording Costs: There are two sets of costs, fixed and variable. 2: Enter the BEP Labels and formats:Enter the labels to create the BEP analysis sheet named Break Even.
3: Create range names Once you have the labels in place, you can create range names to use in formulas. To create the first two, select B2:C3, click the Formulas tab, click the Create From Selection option in the Defined Names group, and then click OK. Repeat this process with B5:C6, B8:C9, and B11:C11. (Excel will embed underscore characters between the words in the names.)
4: Enter BEP formulas Now you're ready to enter the formulas that will generate the BEP value. Table A identifies each formula and its cell and offers a brief explanation.Table A
5: Enter costs Return to the cost tables and enter the appropriate values for your new product. Feel free to alter these tables as necessary. Figure C shows the values we'll use to illustrate how this part of the template works.
Figure D 6: Input BEP variables Once you have costs to evaluate, you can enter your best guess unit price and unit sold value to generate the BEP. Figure D shows the results of entering 15 and 500, respectively. The BEP point is 134, which means you must sell 134 units to incur no losses during the period.
7: Enter labels for a sales analysis sheet At this point, you might consider your template done. But you can enhance the template by providing a broader picture — a sales analysis sheet. Figure E shows such a sheet, named Sales Analysis. Again, the fill color indicates input values, which you can alter to refine the picture to reflect your product. The unit sales row uses the Numeric format with no decimal points. The rest of the value grid uses Currency.
Table B 8: Enter sales analysis formulas Use Table B to enter the appropriate formulas into column B. After entering the anchor formulas in column B, copy them to the remaining cells in the grid, C2:L5.
9: Use the grid Using the finished grid, you can make a few determinations: The BEP is low during the period. You might consider lowering the price to increase sales. Increasing the price will lower your BEP. Both statements are generic, but the analysis provides insight you need to make the best decisions. 10: Finish the template With the formulas in place, you're ready to finish the template. First, delete all the input values in both costs tables and in BreakEven!C2:C3. Next, you might want to enable protection to protect your formulas, as follows: 1. Select BreakEven!C2:C3. 2. Right-click the selection and choose Format Cells. 3.Click the Protection tab. 4. Uncheck Locked. 5. Click OK.
Limitations of Break Even Analysis: • Breakeven analysis assumes that fixed cost, variable cost and sales revenue behave in linear manner .However some overhead costs may be stepped in nature. The straight line and total cost line tend to curve beyond certain level of production. • It is assumed that all production is sold. The breakeven chart does not take the changes in stock level into account • Breakeven analysis can provide information for small and relatively simple companies that produce same product . It is not useful for the companies producing multiple products.