Download
1 / 28
280 likes | 418 Views
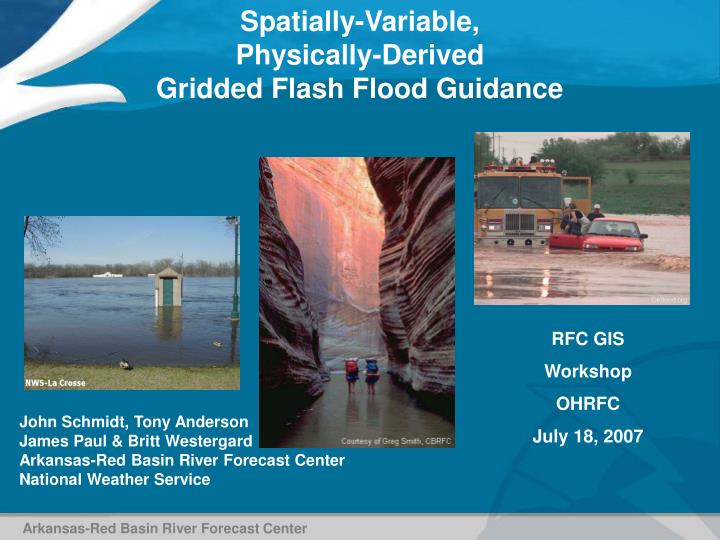
Spatially-Variable, Physically-Derived Gridded Flash Flood Guidance. RFC GIS Workshop OHRFC July 18, 2007. John Schmidt, Tony Anderson James Paul & Britt Westergard Arkansas-Red Basin River Forecast Center National Weather Service. Arkansas-Red Basin River Forecast Center.

E N D
Spatially-Variable, Physically-Derived Gridded Flash Flood Guidance RFC GIS Workshop OHRFC July 18, 2007 John Schmidt, Tony Anderson James Paul & Britt Westergard Arkansas-Red Basin River Forecast Center National Weather Service Arkansas-Red Basin River Forecast Center
Legacy Basin, County and Gridded Flash Flood Guidance 60-day precipitation accumulation in Pawnee County, KS ending December 21, 2006. Arkansas-Red Basin River Forecast Center
Goal of GFFG… • Produce a flash flood guidance product at a resolution of 1-20 mi2 rather than 150-2000 mi2 that: • reflects the spatial variability of physical characteristics that impact the susceptibility of a location to flash flooding, • uses freely available data (or easily manufactured data) with nation-wide coverage, • requires minimal calibration effort and • fits seamlessly into the existing RFC and WFO operational flash flood warning architecture. Arkansas-Red Basin River Forecast Center
Issues of Scale and Spatial Variability Courtesy of Greg Smith, CBRFC Point A: Parunuweap Canyon (10 mi NW of Point B) Courtesy of Greg Smith, CBRFC Courtesy of Greg Smith, CBRFC Point B: Sand dunes near Moquith Mountain Arkansas-Red Basin River Forecast Center
Issues of Scale and Spatial Variability Basin/County/FFMP Arkansas-Red Basin River Forecast Center
NRCS Curve Number Rainfall-Runoff Model for New Orleans, LA 30m NLCD Land Use Land Cover Data + Resultant NRCS Curve Number 1000m STATSGO HSG Data Arkansas-Red Basin River Forecast Center
UZFWC UZTWC LZFPC LZFSC LZTWC Calculating Soil Moisture Conditions Using a Distributed Hydrologic Model National Weather Service Office of Hydrologic Development Research Distributed Hydrologic Model 4km gridded precipitation Sacramento Model Storages Upper Zone Saturation Ratio UZ Sat Dry Wet 4km gridded soil moisture products Arkansas-Red Basin River Forecast Center
Varying Curve Numbers by Antecedent Soil Moisture Conditions 75% Upper Zone Saturation * Soil Moisture Adjusted Curve Number Average Curve Number Arkansas-Red Basin River Forecast Center
Threshold Runoff (ThreshR) Calculation ThreshR is an estimate of the amount of runoff required in a given basin area to produce flooding flows. Peak Unit Flow = 1300 cfs Flood Flow = 800 cfs ThreshR = Flood Flow / Peak Unit Flow ThreshR = 800 / 1300 = 0.62 Arkansas-Red Basin River Forecast Center
ThreshR Calculation Legacy ThreshR ThreshR Flood Flow (Qs) Qs =f (design storm, slope, curve number) . | . Peak Unit Flow (Qp) Qp =f (slope, curve number) Arkansas-Red Basin River Forecast Center
GFFG Calculation S = (1000/CN)-10 Q = ThreshR Arkansas-Red Basin River Forecast Center
3-Hr Basin-Averaged FFG 09/17-18/2006 12zKeystone Reservoir, OK Basin-averaged FFG product from September 17, 2006 24-hour rainfall ending September 18, 2006 12z Basin-averaged FFG product from September 18, 2006 Arkansas-Red Basin River Forecast Center
3-Hr Gridded FFG 09/17-18/2006 12zKeystone Reservoir, OK Gridded FFG product from September 17, 2006 24-hour rainfall ending September 18, 2006 12z Gridded FFG product from September 18, 2006 Arkansas-Red Basin River Forecast Center
March 23-24, 2007 Precipitation (6-hour Update Interval) Arkansas-Red Basin River Forecast Center
March 23-24, 2007 GFFG (6-hour Update Interval) Arkansas-Red Basin River Forecast Center
June 15, 2006 3-hr Operational FFG Arkansas-Red Basin River Forecast Center
June 15, 2006 3-hr Experimental FFG Arkansas-Red Basin River Forecast Center
Future Work • Verification and Evaluation • Thresh-R Customization Methods and Tools • Variable Thresh-R • Project Expansion Arkansas-Red Basin River Forecast Center
Verification and Evaluation Arkansas-Red Basin River Forecast Center
Verification and Evaluation Arkansas-Red Basin River Forecast Center
Thresh-R Customization Technique and GUI • Allow WFOs (or RFCs) to overwrite estimated Thresh-R values at locations where the assumptions of bankfull flow are not close to reflecting the local reality. • Consists of a simplified surveying exercise, the calculation of velocity and “flash flood flow” from that survey and the re-writing of the Thresh-R xmrg with a “burned-in” value at the HRAP grid cell that represents that particular flash flood location. Arkansas-Red Basin River Forecast Center
Honey Creek Taylor Falls State Park, OK Arkansas-Red Basin River Forecast Center
Thresh-R Customization Data Roughness = Manning’s n estimation Arkansas-Red Basin River Forecast Center
Spunky Creek at East 11th St. Tulsa OK Arkansas-Red Basin River Forecast Center
V = 2.71 fps Qs = 217 cfs If Qp = 558 cfs, Thresh-Rmeas = 0.39 vs. Thresh-Rest = 0.62 or FFGmeas = 2.03 vs. FFGest = 2.45 Arkansas-Red Basin River Forecast Center
Using NRCS Unit Hydrograph and Hourly RDMS Runoff to Estimate Variable Thresh-R - 0 .1 - tp = 2.5 D = 1.0 Qp = 600 Tb = 5.0 .2 Let Qs = 500 cfs - .3 - 310/500=0.62 Variable T-R = (1- 0.62) * T-R T-R = 500/600= 0.83 Var T-R = 0.38*0.83 = 0.32 Arkansas-Red Basin River Forecast Center
GFFG Project Expansion • 1, 2, 3, and 6 (any duration) hour gridded FFG and Thresh-R for the ABRFC at sub-synoptic update intervals. • 1, 3, and 6 hour FFG and Thresh-R for 2-3 test WFOs in other NWS regions • 1, 3, and 6 hour FFG and Thresh-R for all of the NWS Southern Region RFCs • Incorporate other GIS datasets (i.e. burn areas) Arkansas-Red Basin River Forecast Center
ABRFC Gridded FFG Questions/Comments ? Arkansas-Red Basin River Forecast Center