Download
1 / 1
10 likes | 170 Views
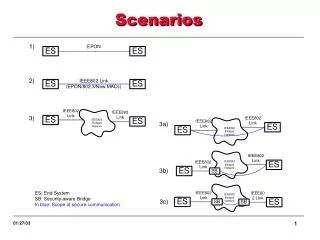
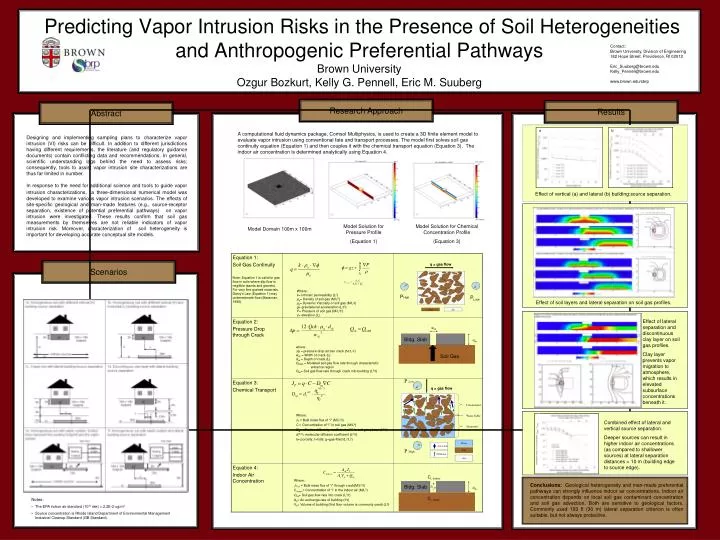
q = gas flow. P High. P Low. Soil. Air. Unsaturated. Water Table. Saturated. Advection. Diffusion. Contact: Brown University, Division of Engineering 182 Hope Street, Providence, RI 02912 Eric_Suuberg@brown.edu Kelly_Pennell@brown.edu www.brown.edu/sbrp.

E N D
q = gas flow PHigh P Low Soil Air Unsaturated Water Table Saturated Advection Diffusion Contact: Brown University, Division of Engineering 182 Hope Street, Providence, RI 02912 Eric_Suuberg@brown.edu Kelly_Pennell@brown.edu www.brown.edu/sbrp Predicting Vapor Intrusion Risks in the Presence of Soil Heterogeneities and Anthropogenic Preferential Pathways Brown UniversityOzgur Bozkurt, Kelly G. Pennell, Eric M. Suuberg Research Approach Results Abstract a b A computational fluid dynamics package, Comsol Multiphysics, is used to create a 3D finite element model to evaluate vapor intrusion using conventional fate and transport processes. The model first solves soil gas continuity equation (Equation 1) and then couples it with the chemical transport equation (Equation 3). The indoor air concentration is determined analytically using Equation 4. Designing and implementing sampling plans to characterize vapor intrusion (VI) risks can be difficult. In addition to different jurisdictions having different requirements, the literature (and regulatory guidance documents) contain conflicting data and recommendations. In general, scientific understanding lags behind the need to assess risks; consequently, tools to assist vapor intrusion site characterizations are thus far limited in number. In response to the need for additional science and tools to guide vapor intrusion characterizations, athree-dimensional numerical model was developed to examine various vapor intrusion scenarios. The effects of site-specific geological and man-made features (e.g., source-receptor separation, existence of potential preferential pathways) on vapor intrusion were investigated. These results confirm that soil gas measurements by themselves are not reliable indicators of vapor intrusion risk. Moreover, characterization of soil heterogeneity is important for developing accurate conceptual site models. Effect of vertical (a) and lateral (b) building:source separation. Model Solution for Pressure Profile (Equation 1) Model Solution for Chemical Concentration Profile (Equation 3) Model Domain 100m x 100m Scenarios PLow Effect of soil layers and lateral separation on soil gas profiles. Effect of lateral separation and discontinuous clay layer on soil gas profiles. Clay layer prevents vapor migration to atmosphere, which results in elevated subsurface concentrations beneath it. wck Bldg. Slab dck Soil Gas PLow q = gas flow Combined effect of lateral and vertical source separation. Deeper sources can result in higher indoor air concentrations (as compared to shallower sources) at lateral separation distances > 10 m (building edge to source edge). Water PHigh Soil Air Ci, indoor Bldg. Slab Conclusions: Geological heterogeneity and man-made preferential pathways can strongly influence indoor air concentrations. Indoor air concentration depends on local soil gas contaminant concentration and soil gas advection. Both are sensitive to geological factors. Commonly used 100 ft (30 m) lateral separation criterion is often suitable, but not always protective. JT ck dck Ci, crack • Notes: • The EPA indoor air standard (10-6 risk) = 2.2E-2 ug/m3 • Source concentration is Rhode Island Department of Environmental Management Industrial Cleanup Standard (GB Standard).