Download
1 / 46
460 likes | 548 Views
James Walton Chief Economist. Recession and social change implications for co-operative organisations Co-OPERATIVES UK NATIONAL RETAIL CONSUMER CONFERENCE holiday Inn, stratford -upon- avon 25 th February 2012. Follow me on Twitter ... @jameswalton_IGD. The Heart Of England. We are here.

E N D
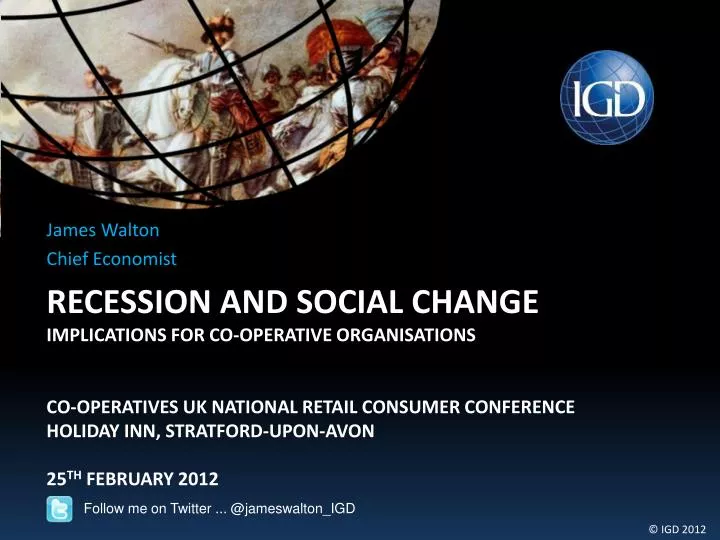
James Walton Chief Economist Recession and social changeimplications for co-operative organisationsCo-OPERATIVES UK NATIONAL RETAIL CONSUMER CONFERENCEholiday Inn, stratford-upon-avon25th February 2012 Follow me on Twitter ... @jameswalton_IGD
The Heart Of England We are here
Edge Hill, 23rd October 1642 Image: www.thinkstockphotos.com, February 2011
Depression And War – Some Long Term Legacies New global institutions Universal view of human rights Modern feminism Socialised healthcare Images: www.thinkstockphotos.com, February 2011
Euro Area Sovereign Debt SGP legal limit on government debt Source: Table 78, Statistical Annex Of European Economy (November 2011), EU Commission Data is EU Commission estimates for full year 2011
Where The Money Goes Source: Eurostat / IGD Research, February 2012 (data is for 2009, latest consistent data available) “Paternal” functions are: defence and protection “Maternal” functions are: education, health, pensions and welfare
What Next? • If a Euro Area member defaults on sovereign debt: • Banks that have supported that member lose their shirts • Lenders panic, “contagion” spreads across the world • Business is paralysed, confidence plummets • Nations that have contributed to bailouts lose money • Stored “paper” wealth is annihilated on a vast scale • New Credit Crunch for governments and businesses, as lenders flee from risk • Social unrest as wages and benefits go unpaid • Inflation, as QE is used to erode the value of debt • The value of the Eurocrashes • Rampaging trolls descend from hills • Recession – a really bad one this time • If disaster is averted: • Same, only less so (ie: fewer trolls, with smaller clubs)
A Phenomenal Personal Record Source: US Treasury, February 2012 Images: www.thinkstockphotos.com, February 2012 Debt issued by first 43 presidents: US$10.6 trillion (in 220 years) Debt issued by 44th president : US$4.7 trillion (in 3 years)
Global Commodity Price Trends Volatility indicates supply shortfalls across multiple items Slight falls in price in late 2011 reflect weakening demand in major economies As costs rise, so the cost of waste goes up – processing, packaging and logistics become more critical Source: IMF, February 2012 Indices rebased by IGD
Implications 1 • The future remains extremely uncertain • Businesses must stay alert – is your information good enough? • Plans must remain flexible – how often do you review yours? • Speedy decision making is vital – how fast are your procedures? • The banking sector is exposed to serious sovereign debt risk (therefore we all are) • Do not expect the credit situation to ease – it may worsen • Capital will remain scarce – luckily, grocery businesses are often cash rich • Expect businesses to hoard cash – payment terms will be hotly contested • Currency / commodity values may fluctuate wildly • Hedging may protect businesses from price volatility • Currency change may create unexpected trading / acquisition opportunities • Watch the situation in the Persian Gulf carefully
UK GDP Performance Revised data shows that UK recession was more severe than initially thought, but growth in run-up to recession was stronger Recovery has been weak and patchy Danger of a double dip has risen in the last week Source: ONS, February 2012 Data is seasonally adjusted Letter codes refer to specific ONS measures, dotted line shows November OBR forecast
Household Spending – Top Level Gaps show permanent impact of recession on demand Even before the recession, inflation was driving market growth In volume terms, household spending is still below pre-recession levels Source: ONS / IGD Research, February 2012 Data is based on ONS measure abjq, adjusted using an estimated GDP deflator Trend is continuation of average q-on-q growth rate for Q1 2000 to Q4 2007
Household Spending – Per Capita “True” demand is roughly 2006 level Source: ONS / IGD Research, February 2012 Data is based on ONS measure abjq, adjusted using an estimated GDP deflator Trend is continuation of average q-on-q growth rate for Q2 2000 to Q4 2007, per capita data based on population measure dyay
There has been no real volume growth in European grocery since 2008 This is in spite of population growth of +1% (EU) and +2% (UK) over the same period Volume Demand Source: Short Term Business Statistics and Population & Social Conditions, Eurostat, February 2012 Shows measure tovv for g47_food, data is seasonally adjusted, indices rebased by IGD
Trends In Nutrition Dept of Health aims to reduce consumption by a further 100 cals / person / day UK average at-home energy consumption has fallen 5% in 10 years UK average out-of-home consumption has fallen by 15% over the same time Source: Family Food 2010, DEFRA, December 2011 (latest data available) Limited historical data is available for out-of-home consumption
Shopper Mood Is At An All-Time Low Initially, shoppers expected a quick recovery from recession Later on, expectations were revised downwards Source: Nationwide, February 2012 Base: 1,000 UK respondents, balanced sample Indices show consumer confidence compared with May 2004, the base period – data is seasonally adjusted
Shoppers Expect To Be Poorer In Future Personal economic expectations over next 12 months Some signs of an improvement in sentiment in recent months Do shoppers think that things are as bad as they can get? Source: ShopperVista, IGD, February 2012 Base: 1,000 UK main shoppers per month, balanced sample
Growth In Real Wealth Is At A Standstill Av annual change 1980-2000: + 3.0% Av annual change 2001-2010: + 1.9% Av annual change 2011-2016: + 0.6% Source: ONS, February 2012 Shows annual change in household disposable income, adjusted for the effect of taxes, benefits and inflation Data for 2011 onwards is OBR estimates
Implications 2 • A return to recession is still possible • Businesses may wish to maintain a defensive posture • Shoppers are also likely to stay cautious, unwilling to expose themselves • Volume sales for many businesses – including grocery – have been sluggish for years • Achieving scale economies may be difficult – can process innovation help? • In a static market, growth means taking share – expect savage competition • Still, compared with other businesses, grocery still looks like a good bet! • Weak retail performance may impact the value of commercial property • Far-sighted retailers may snap up sites with a view to eventual retail recovery • Independents planning to exit the market may be affected by low prices • Will town centre sites suffer if shoppers shop less?
The Growth Of The Maternal State Current austerity plan is controversial, but modest Source: www.ukpublicspending.co.uk / IGD Research, February 2012 “Paternal” functions are: defence and protection “Maternal” functions are: education, health, pensions and welfare
The Scale Of Austerity – Top Level The austerity currently envisaged is far short of what has been seen elsewhere in Europe but will still mean a significant deviation from the historical trend Source: Table 4.1, Public Expenditure Statistical Analysis and Autumn Statement 2011, HM Treasury / IGD Research, February 2012 Forecasts are based on Autumn Statement document published November 2011 Trend is based on average annual growth for 1980-2010
The Scale Of Austerity – Per Capita Source: Table 4.1, Public Expenditure Statistical Analysis and Autumn Statement 2011, HM Treasury / IGD Research, February 2012 Forecasts are based on Autumn Statement document published November 2011 Trend is based on average annual growth for 1980-2010, per capita data is based on population measure dyay
Real Pain Still To Come Current austerity programme will interrupt expansion of debt, but not for long Debt not expected to return to pre-recession levels Source: Fiscal Sustainability Report, Office For Budget Responsibility, July 2011
Reliance On State Support Source: Table 2.1, Family Resources Survey 2009-10, Dept Of Work & Pensions, February 2012 (latest data available)
Reliance On Public Sector Employment Source: Public Sector Employment, ONS, February 2012 (data is for Q1 2011)
Impact On Families • Most affected ... • Households with 3 or more children • Households with younger children • Households in rented accommodation • Non-white households • Lone parents not currently in work • Carers Source: The Impact Of Austerity Measures On Households With Children, IFS and FPI, January 2012
Economic / Social Variation By Neighbourhood Sources: Local Alcohol Profiles For England / Nomis / ONS / UpMyStreet , February 2012 Crime rates show offences per 1,000 / year, for 2010-11 GCSE results show share of pupils attaining 5 or more A*- C grades, for nearest state secondary school for 2010 Employment data is for 2010, prevalence of binge drinking is estimate for 2007-08 from LAPE
Ink Blot Protests Images: Private collection, all taken at St Paul’s, London, November 2011
Public Health Responsibility Deal • Launched March 2011 • Businesses and other organisations are invited to sign up to pledges • There are 19 pledges, covering: • Alcohol (7) • Food (3) • Health at work (4) • Physical activity (5) • Pledges are made public via Dept of Health website • Businesses are expected to report on progress • 273 companies signed up in the first six months (including co-ops) • New pledge under discussion – reduce food consumption by 100 cals / person / day
Implications 3 • Poor economic performance may lead government to adjust its tax / spending plans • The impact of austerity will vary widely by location, age, job etc • Businesses will need to be sensitive to these variations • Even if plans stay the same, austerity will create revolutionary change • Austerity impacts will aggravate existing harms caused by recession • Social / economic / political change will influence how people interact with businesses • Any business not creating clear social benefits may be seen as “fair game” • Small businesses cannot survive unscathed if the host community weakens • Some products (eg: BWS, sugar) may be targeted for special tax increases • Plan for further legal intervention in marketing, advertising etc • Plan for further reductions in food volumes
Inflation May Have Peaked VAT increases begin to annualise from Jan 2012 Source: ONS, February 2012 Data is seasonally adjusted, values are given at market prices Letter codes refer to specific ONS measures
Food Price Inflation Is Also Easing What happens if food price inflation halts or reverses? Source: ONS, February 2012 Data is seasonally adjusted, values are given at market prices Letter codes refer to specific ONS measures
Shoppers Anticipate Further Inflation Shopper expectations for retail food prices over the next 12 months Source: ShopperVista, IGD Research, February 2012 Base: all main shoppers
Focus On Saving Money Shopper focus on quality rather than price, next 12 months Lowest level of interest in quality recorded Dec-11 Quality will become … … than saving money Source: ShopperVista, IGD Research, February 2012 Base: all main shoppers
How Shoppers Intend To Adapt Intended to change in grocery shopping behaviour, next 6 months Source: ShopperVista, IGD Research, February 2012 Base: all main shoppers
Expected Change To Purchasing Of PL Products Source: ShopperVista, IGD Research, February 2012 Base: all main shoppers
Retailer Shares & Growth + 2.1% YOY - 1.3% YOY Xmas + 8.2% YOY + 1.3% YOY Q3 + 5.0% YOY + 2.1% YOY Xmas + 3.7% YOY + 0.7% YOY Xmas • 1.1% YOY • +3.1% YOY Xmas + 7.2% YOY + 3.8% Xmas + 11.3% YOY Source: Worldpanel, Kantar, February 2012 Asda includes Netto for 2010 and 2011, Co-operative includes Somerfield for all dates Data is value market share over a 12 week period, white trend data is Kantar growth measure, red trend is retailer LFL
Current Retailer Concerns • Key areas • Shopper marketing • Shopper insight • Loyalty activity • Mission-based approach • Key areas • Purchasing optimisation • Inventory reduction • Cost saving programmes • Improved logistics • Key areas • Driving like-for-like growth • Format innovation • Private label expansion • Improving the shopping experience
Grocery Channel Forecasts To 2016 Source: IGD Research, February 2012
Asda – A Sample Netto Conversion Images: Retail Analysis, IGD Research, February 2012 From visit to South Harrow store, August 2011
Little Waitrose – Emphasising Healthy, Premium Food Images: Retail Analysis, IGD Research, February 2012 From visit to Watford store, October 2011
Online – A Period Of Explosive Development Online – Potential to change the nature of relationships between shoppers and businesses Online retailing, for groceries and non-groceries is growing rapidly across Europe The UK is perhaps the most advanced European market but, even so, still offers lots of headroom for further growth The migration of trade to the online environment increases market transparency and thus price competition The growth of online may, in time, change the character of town centres If shoppers switch, say, 10% of their trips to online, what would the footfall impact for traditional retailers be? Image: www.thinkstockphotos.com, February 2012
The New Digital Battleground • The technological base for a digital retail revolution have been in place for a while • However, the smartphone may prove to be the “killer” technology • Smartphones combine the power of the Internet with the freedom of a mobile • In particular, the smartphone is a “personal” technology unlike, say, a desktop PC • Retailers are investing heavily in this technology but are only scratching the surface • Given the pace of change, 2012 could be the year the smartphone comes of age • Next step … “augmented reality”? • Currently, digital media is being used primarily as “remote control” for consumption • Long term, the bigger prize may be the opportunity to build relationships / community • Consider – businesses now ask shoppers to “be their Friends” on Facebook • Being “friends” means that businesses can build personal dialogues with customers • However, new technologies also offer pitfalls • Increased market transparency pushes the pace of price competition • If technology allows shoppers to be more agile, the penalty for loss of trust is higher Image: www.thinkstockphotos.com, February 2012
Reasons For Using Multiple Channels Source: Shoppers’ Evolving Channel Mix, IGD Research, April 2011 Base: 4,438 main grocery shoppers (France 915, Germany 882, Netherlands 877 Spain 880, UK 884 – balanced samples) Coloured text indicates significant difference from study average (green = more likely, red = less likely)
Implications 4 • Inflation may be easing • Perceptions of inflation may differ from reality • Even with inflation slowing, real incomes will be under severe pressure • Deconsumerisation • So far, shoppers have responded to pressure by finding was to buy for less • What happens when this stops working – will shoppers simply buy less? • Will shoppers go further and abandon grosser elements of consumerism? • Retail change • How will co-ops be impacted by ongoing development in convenience retail? • Are co-ops leveraging digital technology to the highest degree? • Are co-ops getting the best pay-off from funds invested in promotion? • Are co-op PL ranges still competitive with best-in-class?