Download
1 / 22
220 likes | 360 Views
Automated Analysis of Spectra. C. Allende Prieto University of Texas. Contents. Classification/Analysis Available methods MDM: interpolation and optimization Practical examples: high-resolution and SDSS Summary. Data flow. Data Acquisition Reduction Analysis

E N D
Automated Analysis of Spectra C. Allende Prieto University of Texas
Contents • Classification/Analysis • Available methods • MDM: interpolation and optimization • Practical examples: high-resolution and SDSS • Summary
Data flow Data Acquisition Reduction Analysis Interpretation
? Classify:
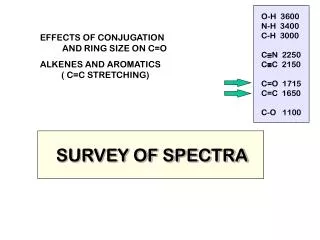
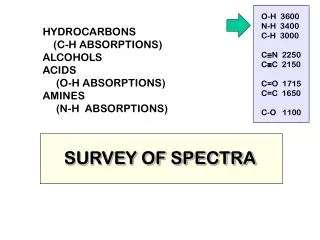
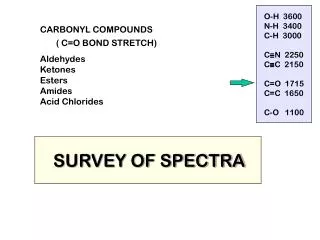
---- 12 ---- 18 ---- 15cm Analyze:
Best-seller list • Principal Component Analysis (PCA) • Minimum Distance Methods (MDM) • Artificial Neural Networks (NN) • Bayesian Probabilistic Models (BPM)
Basic summary of properties Technique Training Easy to Interpretability required Implement? BPM √ √ MDM √ √ NN √ √
To train or not to train: NN vs. MDM • Pay in full or in installments • Flexibility • Inmunity to S/N variations • Performance
MDM: Interpolation • Brute force approach • Interpolation: monotonic; linear, quadratic, cubic …
MDM: Optimization • Steepest descent, Newton’s method, Levenberg-marquardt method • With no help from derivatives: Nelder-Mead simplex method • Being global: Genetic algorithms, simulated annealing
MDM: Weighting • Wi=1 • S/N variations with wavelength • Accuracy of the model (function of wavelength and parameters) • Sensitivity • Balance
Applications HIGH-RES SPECTRA • R=60,000 observations of Hyades members • Teff/logg/[M/H] from de Bruijne et al. (2001) • MDM implementation: - grid of synthetic spectra f(Teff,logg,[M/H],[Fe/H],vsini) - linear interpolation - Nelder-Mead simplex optimization
Applications: SDSS Spectra+Photometry • Sloan Digital Sky Survey: lots of galaxies, but also stars (calibrators, BHB, M-dwarfs, errors) • R ~ 2000 spectra (381-910 nm) + ugriz photometry • DR2 includes 50,000+ stellar spectra 14<V<22; distances up to a few hundred Kpc
Summary • NN rulewhen Nobj is very large • MDM with interpolation + optimization are competitive, especially at low Nobj • The largest projects will require custom-made NN systems, but • Mid-size and small projects may share software changing only the grids of templates
Data Acquisition Reduction Analysis Data flow Data Acquisition Reduction Analysis SIMBAD Data Acquisition Reduction Analysis