Download
1 / 1
10 likes | 143 Views
Eugeniya Starikova. Laboratory of Theoretical Spectroscopy of IAO SB RAN, av. Akademicheskii 1, 634055 TOMSK, Russia. Marie-Renée De Backer-Barilly , Alain Barbe , Vladimir G. Tyuterev. threshold. Laser OFF.

E N D
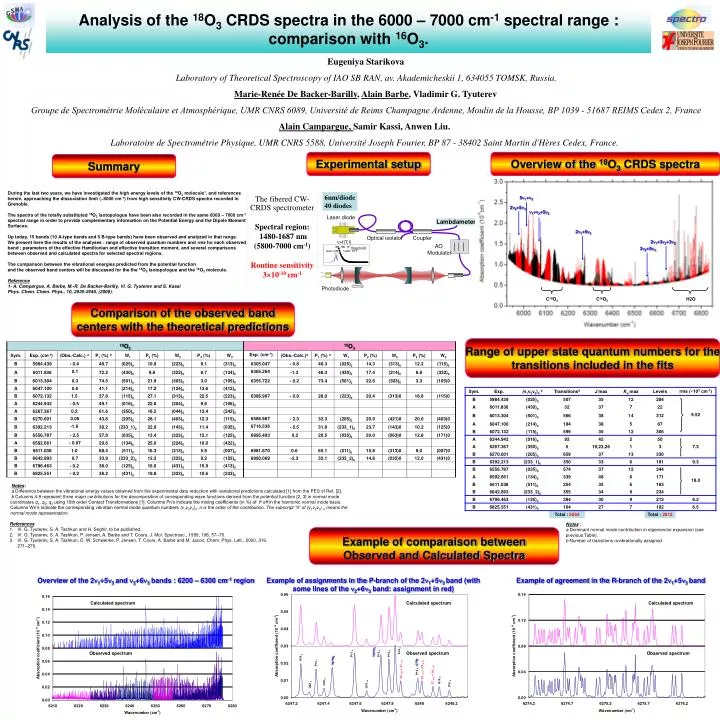
Eugeniya Starikova Laboratory of Theoretical Spectroscopy of IAO SB RAN, av. Akademicheskii 1, 634055 TOMSK, Russia. Marie-Renée De Backer-Barilly, Alain Barbe, Vladimir G. Tyuterev threshold Laser OFF Groupe de Spectrométrie Moléculaire et Atmosphérique, UMR CNRS 6089, Université de Reims Champagne Ardenne, Moulin de la Housse, BP 1039 - 51687 REIMS Cedex 2, France Alain Campargue, Samir Kassi, Anwen Liu. 100 -50 0 50 Laboratoire de Spectrométrie Physique, UMR CNRS 5588, Université Joseph Fourier, BP 87 - 38402 Saint Martin d'Hères Cedex, France. Example of comparaison between Observed and Calculated Spectra Experimental setup Summary During the last two years, we have investigated the high energy levels of the 16O3 molecule1, and references herein, approaching the dissociation limit (~8000 cm-1) from high sensitivity CW-CRDS spectra recorded in Grenoble. The spectra of the totally substituted 18O3 isotopologue have been also recorded in the same 6000 – 7000 cm-1 spectral range in order to provide complementary information on the Potential Energy and the Dipole Moment Surfaces. Up today, 15 bands (10 A-type bands and 5 B-type bands) have been observed and analyzed in that range. We present here the results of the analyses : range of observed quantum numbers and rms for each observed band ; parameters of the effective Hamiltonian and effective transition moment, and several comparisons between observed and calculated spectra for selected spectral regions. The comparison between the vibrational energies predicted from the potential function and the observed band centers will be discussed for the the 18O3isotopologue and the 16O3 molecule. Reference 1- A. Campargue, A. Barbe, M.-R. De Backer-Barilly, Vl. G. Tyuterev and S. Kassi Phys. Chem. Chem. Phys., 10, 2925-2946, (2008). 6nm/diode 40 diodes 5n1+n3 The fibered CW-CRDS spectrometer Spectral region: 1480-1687 nm (5800-7000 cm-1) Routine sensitivity 310-10 cm-1 2n2+5n3 n1+n2+5n3 Laser diode Lambdameter 2n1+5n3 Optical isolator Coupler n=f(T,I) 2n1+3n2+3n3 AO Modulator 3n2+5n3 laser ON Photodiode C18O2 C16O2 H2O Comparison of the observed band centers with the theoretical predictions Range of upper state quantum numbers for the transitions included in the fits Overview of the 18O3 CRDS spectra Overview of the 2n1+5n3 and n2+6n3 bands : 6200 – 6300 cm-1 region Example of assignments in the P-branch of the 2n1+5n3 band (with some lines of the n2+6n3 band: assignment in red) Example of agreement in the R-branch of the 2n1+5n3 band Calculated spectrum Calculated spectrum Calculated spectrum 12C18O2 P18 2 Observed spectrum Observed spectrum Observed spectrum P16 5 P15 6 P17 4 P19 0 12C16O2 P14 7 P12 8 ; C18O 22 0 2221 1 21 23 1 2322 0 22 27 2 2626 1 25 Q15 11 Q16 9 Q22 9 Q19 10 P10 9 Analysis of the 18O3 CRDS spectra in the 6000 – 7000 cm-1 spectral range : comparison with 16O3. Notes: a Difference between the vibrational energy values obtained from the experimental data reduction with variational predictions calculated [1] from the PES of Ref. [2]. b Columns 4-9 represent three major contributions for the decomposition of corresponding wave functions derived from the potential function [2, 3] in normal mode coordinates q1, q2, q3 using 10th order Contact Transformations [1]. Columns Pn’s indicate the mixing coefficients (in %) of eff in the harmonic normal mode basis. Columns Wn’s indicate the corresponding vibration normal mode quantum numbers (v1v2v3)0. n is the order of the contribution. The subscript “0” of (v1v2v3) 0 means the normal mode representation. • References • Vl. G. Tyuterev, S. A. Tashkun and H. Seghir, to be published. • Vl. G. Tyuterev, S. A. Tashkun, P. Jensen, A. Barbe and T. Cours, J. Mol. Spectrosc., 1999, 198, 57–76. • Vl. G. Tyuterev, S. A. Tashkun, D. W. Schwenke, P. Jensen, T. Cours, A. Barbe and M. Jacon, Chem. Phys. Lett., 2000, 316, 271–279. Notes : a Dominant normal mode contribution in eigenvector expansion (see previous Table). b Number of transitions rovibrationally assigned