Download
1 / 54
540 likes | 759 Views
Value At Risk. IEF 217a: Lecture Section 5 Fall 2002 Jorion Chapter 5. Value-at-Risk (VaR). Probabilistic worst case Almost “perfect storm” 1/100 year flood level. VaR Advantages. Risk -> Single number Firm wide summary Handles futures, options, and other complications

E N D
Value At Risk IEF 217a: Lecture Section 5 Fall 2002 Jorion Chapter 5
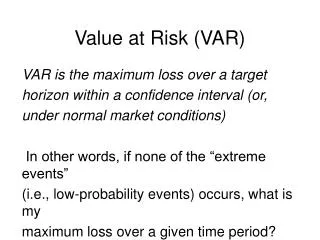
Value-at-Risk (VaR) • Probabilistic worst case • Almost “perfect storm” • 1/100 year flood level
VaR Advantages • Risk -> Single number • Firm wide summary • Handles futures, options, and other complications • Relatively model free • Easy to explain • Deviations from normal distributions
Value at Risk (VaR)History • Financial firms in the late 80’s used it for their trading portfolios • J. P. Morgan RiskMetrics, 1994 • Currently becoming: • Wide spread risk summary • Regulatory
Value at Risk: Methods • Methods • Delta Normal • Historical • Monte-carlo • Bootstrap
Outline • Computing VaR • Interpreting VaR • Time Scaling • Regulation and VaR • Jorion 3, 5.2.5-5.2.6 • Estimation errors
Computing VaR • Mark to market (value portfolio) 100 • Identify and measure risk factor variability Normal: mean = 0, std. = 0.1 over 1 month • Set time horizon 1 month • Set confidence level 5%
Portfolio value today = 100, Normal returns (mean = 0, std = 10 per month), time horizon = 1 month, 5% VaR = 16.4
Normal Distributions • Many VaR calculations can be done using tables • Find percentile value for confidence level for normal, mean 0, std = 1 using standard tables • For 0.05 level, this is –1.64 • Critical return (R*) = std(percentile value) = 0.1*(-1.64) = -0.164 • W* = W(1+R*) = 100(1-0.164) = 83.6 • VaR = Loss = W – W* = 100-83.6 = 16.4
Normal DistributionsNonzero Mean (Absolute VaR) • Assume std = 0.10, mean = 0.05 • Critical return (R*) = mean + std(percentile value) = 0.05+0.1*(-1.64) = -0.114 • W* = W(1+R*) = 100(1-0.114) = 88.6 • VaR = Loss = W – W* = 100-88.6 = 11.4 • This is known as Absolute VaR • Absolute dollar loss
Normal DistributionsNonzero Mean (Relative VaR) • Assume std = 0.10, mean = 0.05 • Critical return (R*) = mean + std(percentile value) = 0.05+0.1*(-1.64) = -0.114 • W* = W(1+R*) = 100(1-0.114) = 88.6 • Relative VaR is measured relative to expected wealth in the future • VaR = Loss = E(W) – W* = 100(1.05)-88.6 = 16.4 • This is known as Relative VaR
Absolute versus Relative VaR • Absolute • Measure total loss possible against today’s wealth • Relative • Measure loss against expected increases in today’s wealth. • If portfolio is expected to grow by 10 percent, measure loss relative to this growth • If means are positive, then relative VaR will be larger (more conservative) • If means are near zero (short horizons) then they are the same
Normal Distributions in Practice • Assume returns are normal • Estimate mean and std using data • Then get VaR using tables or monte-carlo
Historical VaR • Use past data to build histograms • Method: • Gather historical prices/returns • Use this data to predict possible moves in the portfolio over desired horizon of interest
Easy Example • Portfolio: • $100 in the Dow Industrials • Perfect index tracking • Problem • What is the 5% and 1% VaR for 1 day in the future?
DataDow Industrials • dow.dat (data section on the web site) • File: • Column 1: Matlab date (days past 0/0/0) • Column 2: Dow Level • Column 3: NYSE Trading Volume (1000’s of shares)
Matlab and Data Files • All data in matrix format • “Mostly” numerical • Two formats • Matlab format filename.mat • ASCII formats • Space separated • Excel (csv, common separated)
Loading and Saving • Load data • “load dow.dat” • Data is in matrix dow • Save data • ASCII • save -ascii filename dow • Matlab • save filename dow
Example: Load and plot dow data • Matlab: pltdow.m • Dates: • Matlab datestr function
Back to our problem • Find 1 day returns, and apply to our 100 portfolio • Matlab: dnormdvar.m • Methods used • Delta normal (tables) • Historical • Note difference
Outline • Computing VaR • Interpreting VaR • Time Scaling • Regulation and VaR • Jorion 3, 5.2.5-5.2.6 • Estimation errors
Interpreting VAR • Benchmark measure • Compare risks across markets in company • Flag risks appearing over time • Potential loss measure • Worst loss • Equity capital
Outline • Computing VaR • Interpreting VaR • Time Scaling • Regulation and VaR • Jorion 3, 5.2.5-5.2.6 • Estimation errors
Time Scaling • VaR calculations can be made beyond 1 period in the future • Time scaling • Analytic • Monte-carlo
Scale Factors and Analytics (Jorion) • Reminder • Let r(t) be a random return (independent over time)
Scaling in Words • Mean: scales with T • Std. : scales with sqrt(T) • Reminder: needs independence
Three Methods • Approximate scaling • Exact (log normal) scaling • Bootstrap/monte-carlo
Approximate • Assume that long horizon returns are the sum of the short horizon returns
Computing VaR • Mark to market (value portfolio) 100 • Identify and measure risk factor variability Normal: mean = 0, std. = 0.1 over 1 month • Set time horizon 6 months (before 1 month) Std = sqrt(6)0.1=0.245 • Set confidence level 5%
6 Month VaR • Many VaR calculations can be done using tables • Find percentile value for confidence level for normal, mean 0, std = 1 using standard tables • For 0.05 level, this is –1.64 • Critical return (R*) = std(percentile value) = sqrt(6)*0.1*(-1.64) = -0.40 • W* = W(1+R*) = 100(1-0.40) = 60 • VaR = Loss = W – W* = 100-60 = 40
Exact Methods • Assume that prices are a “geometric random walk” with normal increments
Critical Return • Let R* be the alpha critical value for the T period log return • Now define the future wealth level at the alpha level by
Computing VaR • Mark to market (value portfolio) 100 • Identify and measure risk factor variability. Assume log returns are distributed: Normal: mean = 0, std. = 0.1 over 1 month • Set time horizon 6 months (before 1 month) Std = sqrt(6)0.1=0.245 • Set confidence level 5%
6 Month VaR Exact(approximate numbers) Find percentile value for confidence level for normal, mean 0, std = 1 using standard tables • For 0.05 level, this is –1.64 • Critical return (R*) = std(percentile value) = sqrt(6)*0.1*(-1.64) = -0.40 • W* = W(1+R*) = 100*exp(-0.40) = 67 (60) • VaR = Loss = W – W* = 100-67 = 33 (40)
Bootstrap Methods • If the 1 period return distribution is unknown, and you don’t want to hope the central limit theorem is working at T periods, then a bootstrap might be a good way to go • Resample 1 period returns, T at a time, and build a histogram for the T period returns • Use this to find the alpha critical value for wealth
Examples From Data • Matlab: • hist10d.m • hist10dln.m
Outline • Computing VaR • Interpreting VaR • Time Scaling • Regulation and VaR • Jorion 3, 5.2.5-5.2.6 • Estimation errors
Regulation and Basel Capital Accord • 1988 • Minimum capital requirements • Agreed minimum for signing central banks • Why? • Avoid global systemic risk
The Early Basel Formulas • Capital back must be at least 8% of “risk weighted” assets • Risk weighting increases arbitrarily across asset classes
Criticism • Ignores risk mitigation (hedging) methods • Ignores diversification effects • Ignores term structure effects • Too few risk classes • Ignores market risk
Standardized Model (1993) • More classes • New formulaic risk measures • Problems • Still arbitrary formulas and classes • Misses diversification effects • Ignores internal risk management methods
Internal Models Approach1995 • Radical Change • Core component (VaR) • 10 trading day VaR • 99 percent confidence • Max ( last 60 days VaR, today’s VaR) • Use at least 1 year of historical data • Scale factor (3 or more) • Plus factor if bank’s numbers look unreliable
Scale Adjustment • Find 99% quantile return for 10 day period • R* • Adjust this by a factor of 3 • 3*R* • Why 3? • Trying to eliminate failures
An Example Using the Delta-Normal Approximation • Estimate distribution of 1 day returns • Normal, mean = 0, std = 0.01 • Find the 10 day std. • sqrt(10)*0.01 = 0.032 • Mean = 0*10 = 0 • Get the 99% return level from tables • 2.33*0.032 = 0.075
An Example Using the Delta-Normal Approximation • Get the 99% return level from tables • 2.33*0.032 = -0.075 • Critical R* = (k)*0.075 = (3)*-0.075 = -0.225 • 22.5% loss Basel requires cushion for • $100 portfolio -> Capital required = $22.5 • All is standard VaR except for k
Outline • Computing VaR • Interpreting VaR • Time Scaling • Regulation and VaR • Jorion 3, 5.2.5-5.2.6 • Estimation errors
Estimation Errors • Value at Risk is only an estimate • What are its “confidence bands”? • Methods • Analytics (Jorion 5) • Monte-carlo