Download
1 / 40
400 likes | 558 Views
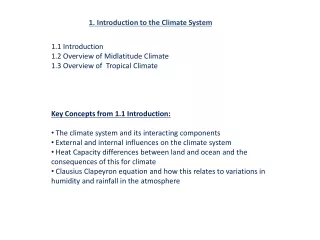
Chapter 1 Introduction to the Climate System. This chapter discusses: Earth’s atmosphere Oceans Cryosphere (sea ice/glacial ice) Land and biosphere. The Effects of the Atmosphere. Blocks ultraviolet radiation. Meteors burn. Sound waves can travel Birds and airplanes can fly

E N D
Chapter 1 Introduction to the Climate System • This chapter discusses: • Earth’s atmosphere • Oceans • Cryosphere (sea ice/glacial ice) • Land and biosphere
The Effects of the Atmosphere • Blocks ultraviolet radiation • Meteors burn • Sound waves can travel • Birds and airplanes can fly • Diffuses heat • Scatters sunlight (blue skies and sunsets) • Hydrologic cycle • Weather and climate
The Atmosphere • A thin envelope around the planet • 90% of its mass (5.1 x 10¹⁸ kg) is within 16 km (10 mi) of the surface (about 0.0025 times the radius of the Earth) • Atmospheric motions can therefore be considered to occur “at” the Earth’s surface • The basic chemical composition of dry air is very uniform across the globe and up to about 100 km • The greatest and most important variations in its composition involve water in its various phases • Water vapor • Clouds of liquid water • Clouds of ice crystals • Rain, snow and hail
TRACE GASES Argon (.93%) and Carbon Dioxide (.03%) Ozone (.000004%) Composition of the Atmosphere Dry Air Solid particles (dust, sea salt, pollution) also exist Water vapor is constantly being added and subtracted from the atmosphere, and varies from near 0% (deserts) to 3-4% (warm, tropical oceans and jungles)
Greenhouse Gases • Nitrogen, Oxygen and Argon (99.9% volume mixing • ratio) have only limited interaction with incoming • solar radiation, and they do not interact with the • infrared radiation emitted by the Earth • A number of trace gases (carbon dioxide, methane, • nitrous oxide, and ozone) do absorb and emit • infrared radiation (as does water vapor) • Water vapor, carbon dioxide and ozone also absorb • solar shortwave radiation • Because they emit infrared radiation up- and • downward, these greenhouse gases increase the • energy received at the Earth’s surface, thus raising • the temperature
Changing Atmospheric Composition: Indicators of the Human Influence Global, well-mixed greenhouse gas (GHG) concentrations CO2 • 31% increase since 1750: Highest levels • since at least 420,000 years ago • Rate of increase unprecedented over • at least the last 20,000 years 1000 1200 1400 1600 1800 2000 Year 1000 1200 1400 1600 1800 2000 Year CH4 • Increased 150% since 1750 to its highest • levels in at least 420,000 years • Has both natural (e.g., wetland) and • human-influenced sources (e.g., landfills, • agriculture, natural gas activities) • Accounts for 20% of total GHG forcing N2O • Increased 16% since 1750 to its highest • levels in at least 1,000 years • Has both natural (e.g., soils and oceans) • and anthropogenic sources • Accounts for 6% of total GHG forcing • Halocarbons (e.g., CFCs) account for 14%
Changing Atmospheric Composition: Indicators of the Human Influence Global, well-mixed greenhouse gas (GHG) concentrations CO2 • 31% increase since 1750: Highest levels • since at least 420,000 years ago • Rate of increase unprecedented over • at least the last 20,000 years CH4 • Increased 150% since 1750 to its highest • levels in at least 420,000 years 1000 1200 1400 1600 1800 2000 Year 1000 1200 1400 1600 1800 2000 Year N2O • Increased 16% since 1750 to its highest • levels in at least 1,000 years • Has both natural (e.g., soils and oceans) • and anthropogenic sources • Accounts for 6% of total GHG forcing • Halocarbons (e.g., CFCs) account for 14%
Changing Atmospheric Composition: Indicators of the Human Influence Global, well-mixed greenhouse gas (GHG) concentrations CO2 • 31% increase since 1750: Highest levels • since at least 420,000 years ago • Rate of increase unprecedented over • at least the last 20,000 years CH4 • Increased 150% since 1750 to its highest • levels in at least 420,000 years N2O • Increased 16% since 1750 to its highest • levels in at least 1,000 years 1000 1200 1400 1600 1800 2000 Year
Composition of the Present Atmosphere Venus Earth Mars Surface Pressure 100,000 mb 1,000 mb 6 mb CO2 >98% 0.03% 96% N2 1% 78% 2.5% Ar 1% 1% 1.5% O2 0.0% 21% 2.5% H2O 0.0% 0.1% 0–0.1%
The Vertical Structure of Earth’s Atmosphere Four layers: Troposphere (overturning) From surface to 8-18 km Stratosphere (stratified) From troposphere top to 50 km Absorption of solar radiation by O3 Mesosphere Extremely thin air; very low temperature Thermosphere Extremely thin air; very high temperature
Vertical Structure of the Atmosphere 4 distinct layers determined by the change of temperature with height
Extends to 10 km in the extratropics, 16 km in the tropics • Contains >80% of the atmospheric mass, and 50% is • contained in the lowest 5 km (3.5 miles) • It is defined as a layer of temperature decrease • The total temperature change with altitude is about 72°C • (130°F), or 6.5°C per km (lapse rate) • It is the region where most weather occurs, and it is kept • well stirred by rising and descending air currents • Near 11 km resides the “jet stream” • The transition region of no temperature change is the • “tropopause”: it marks the beginning of the next layer
Vertical Structure of the Atmosphere 4 distinct layers determined by the change of temperature with height
Extends to about 50 km • It is defined as a layer of temperature increase and • is stable with very little vertical air motion – a good place to fly! • Why does temperature increase? In part because of ozone, formed • as intense ultraviolet solar radiation breaks apart oxygen molecules • Near the ozone maximum (about 25 km), there are still only • 12 ozone molecules for every million air molecules • Yet, the absorption of ultraviolet radiation by ozone shields the • surface and warms the stratosphere • The transition region to the next layer is the “stratopause”
Vertical Structure of the Atmosphere 4 distinct layers determined by the change of temperature with height
Extends to about 85 km • Few ozone molecules, and the extremely thin air loses more energy • than it gains, so the temperature decreases with height • With so few molecules to scatter light, the sky is dark • The air pressure is 1000 times lower than at the surface • (99.9% of the atmosphere’s mass is below the mesosphere) • Exposure to solar radiation would severely burn our bodies! • The transition region to the next layer is the “mesopause”
Vertical Structure of the Atmosphere 4 distinct layers determined by the change of temperature with height
Contains 0.01% of the atmospheric mass • An air molecule can travel 1 km before colliding with another! • If we measure temperature with a thermometer, the reading • is near absolute zero (0 K, or -460°F), not 1500°F. Why? • The temperature of a gas is related to the average speed at • which molecules are moving • Even though air molecules in this region are zipping around at very • high speeds, there are too few to bounce off a thermometer bulb • to transfer energy to record a reading • This explains why astronauts on space walks can survive such high • temperatures: the traditional meaning of “hot” and “cold” is no • longer applicable
Vertical Structure of Earth’s Atmosphere 1. Four layers defined by temperature Troposphere: T decreases with altitude T increases with altitude Stratosphere: Mesosphere: T decreases with altitude Thermosphere: T increases with altitude 2. Importance to climate and climate change • Troposphere: Contains 80% of Earth’s gases Most of Earth’s weather occurs Most of the measurements is available • Stratosphere: Contains 19.9% of Earth’s gases Ozone layer: Blocking Sun’s ultraviolet radiation
Atmospheric Temperature 1. Most widely recognized climatic variable (Global warming) Tc = TK – T0 Tc = temperature in degrees Celsius (°C) = 5(TF – 32)/9 TK = thermodynamic temperature in kelvins (K) T0 = 273.15 K = the freezing point Global mean surface temperature = 288 K, 15°C, 59°F 2. The lapse rate • Γ≡ – ∂T/∂z, Γ > 0 in the troposphere * Varies with altitude, season and latitude * Global mean = 6.5 K km-1 * Determined by a balance between radiative cooling and convection of heat * Γ< 0, temperature inversion At high latitudes in winter and spring
Atmospheric Temperature (continued) 3. Pole-to-pole distribution of zonal-mean temperature * Greatest near the equator, > 26°C; lowest at the poles * Stronger seasonal cycle in the Northern Hemisphere than in the south * Amplitude of the seasonal cycle decreases from the poles to the equator 4. Geographic distributions • * Land heats up and cools down much more quickly than oceans, hence larger seasonal variations. * Large seasonal variations in North America and Asia * Smaller seasonal variations in the Southern Hemisphere. SeeIRI Data Library
Atmospheric Pressure Pressure=Force/Area Pressure decreases with altitude. Gravity pulls gases toward earth's surface, and the whole column of gases weighs 14.7 psi at sea level, a pressure of 1013.25 mb or 29.92 in.Hg. Standard sea level pressure = 101325 Pa = 101.325 kPa = 1013.25 mb
Vertical Pressure Profile Pressure decreases at a curved rate proportional to altitude squared, but near the surface a linear estimate of 10 mb per 100 meters works well.
-dp p+dp dz p gρdz z Hydrostatic Balance Force = Mass × Acceleration Given a unit area with thickness dz, volume = dz, mass = ρdz Gravity force= g ρdz Pressure force= –dp Without atmospheric motions, –dp = gρdz dp/dz = – ρg p(z) = ∫z∞ ρg dz m(z)=p(z)/g m(0)=p(0)/g=ps/g =1.03×10⁴ kg m–2
-dp p+dp dz p gρdz z Hydrostatic Balance (continued) dp/dz = – ρg For an ideal gas, p=ρRT where the gas constant R = 287 J K-1 kg-1 dp/dz=–pg/(RT) dp/p= –dz/H d lnp= –dz/H where H=RT/g=scale height If the atmosphere is isothermal, ∫psp d lnp= ∫0z–dz/H p=psexp(–z/H) H = 7.6 km for the mean T
Water Vapor 1. Highly variable spatially • Less than 1% in a dry atmosphere • More than 3% in the moist tropics • Decreases rapidly with altitude; most is within a few km of the surface • Decreases rapidly with latitude; at the equator is 10 times that at the poles 2. Importance to climate and climate change • * Important part of the water cycle; ocean-to-land atmospheric vapor transport balances land-to-ocean runoff. • * The most important greenhouse gas: water vapor-temperature feedback. • * Water vapor condenses to form clouds, thus clouds–radiation feedback. Clouds release rainfall, reflect solar radiation, and reduce the infrared radiation emitted by Earth.
Oceans Area: covers ~70% of Earth’s surface Volume: ~97% of all the water on Earth Depth: ~3.5 kilometers Albedo: 5-10%, lowest on Earth’s surface Heat capacity: high; thermal inertia: high Temperature: less variable than in the atmosphere Freezing point: –1.9°C, not 0°C Salinity: water and dissolved salts; most common salt: table salt (NaCl). Density: 1034-1035 kg/m3 (greater than pure water 1000kg/m3) Average salinity = 35 parts per thousand (ppt) or 3.5% by weight Density depends on temperature and salinity: Cold water high density Formation of sea ice high density Evaporation high salinity high density Precipitation and river discharge low salinity low density Two main forms of circulation Surface currents: wind-driven, horizontal, surface waters, fast Deep-ocean circulation: thermohaline, vertical, deep waters, slow Surface is not level due to currents, waves, atmosphere pressure, and variation in gravity.
Sea Ice Locations: in the Arctic Ocean surrounded by landmass; in the Southern Ocean, surrounding Antarctica. Depth: ~1–4 m in the Arctic; ~1 m in the Southern Ocean. Longevity: in the Arctic, 4–5 yrs; in the Southern Ocean, forms and melts yearly. Albedo: 60-90%, highest on Earth’s surface Density: less than seawater, hence floats on top. The role in the climate system: Albedo-temperature feedback Prevents the underlying (warm) ocean from interaction with the atmosphere, thus cools the air. Melting of sea ice extracts heat from the atmosphere; Formation of sea ice releases heat to the atmosphere.
Glacial Ice Two forms: Mountain (alpine) glaciers Continental ice sheets. Locations: Near sea-level at hi. lat. > 5 km near equator Antarctica and Greenland (polar ice caps) Sizes: A few km in length, tens to hundreds of m in width and thickness. Hundred to thousands of km in length, 1–4 km in thickness. Area of the two current ice sheets: ~11% of land surface; 70 m sea level rise when all melted. Movement: Flows downhill by gravity along mountain valleys Flows to the lower margins. The weight depresses bedrock. Albedo: 60-90%, highest on Earth’s surface The role in the climate system: Stores 70% of world’s fresh water Changes salinity, circulation and sea level when melt Albedo-temperature feedback
Example of a positive feedback More energy retained in system Albedo decreasesLess solar energy reflected Warm temperatures Ice and snow melt If this were the only mechanism acting, we’d get a runaway temperature increase
The law of the minimum:the factor that is least available has the greatest effect on plants. The law of the maximum:too much of a certain factor also limits a plant’s existence. Global Climate Pattern and Vegetation Af: tropical wet (rainforest); Aw: tropical wet and dry (savanna); Am: tropical monsoon Bs: dry semiarid (steppe); Bw: dry arid (desert) Cs: mediterranean; Cfa: humid subtropical; Cfb: marine Dw: dry winters; Ds: dry summers; Df: wet all seasons ET: polar tundra; EF: polar ice caps
Satellite-Derived Plant Geography Satellite remote sensing provides global, systematic, continuous measurements. Monitor land use and land cover changes. Quantitative. Must be validated by comparing with ground-based data. Early maps are constructed based on atlas, surface surveys. Emphasize climate factors (Precip, Temp). Neglect human factors.