Download
1 / 98
1k likes | 1.15k Views
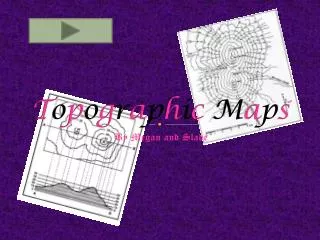
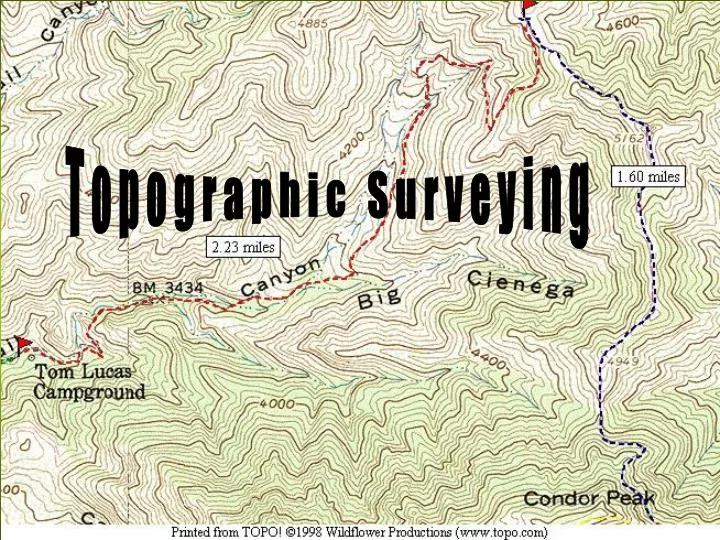
T o p o g r a p h i c S u r v e y i n g. Introduction. Topographic surveys are used to record the information necessary to draw a topographic map. Topo maps are a two dimensional representation of three dimensional objects

E N D
Introduction • Topographic surveys are used to record the information necessary to draw a topographic map. • Topo maps are a two dimensional representation of three dimensional objects • The task is to determine the relief of the earth’s surface and locate critical points on it.
Introduction-cont. • Topographic maps not only record elevation, they also include the important surface features. • The surface features that could be included are: • Slope • Hills • Streams • Lakes • Trees • Soil type • Man-made objects • Etc. • Man-made objects could be: • a) Buildings • b) Water structures • c) Utilities • d) Roads • e) Etc. Not all features should be included on all maps. The features that are included on the map are determined by the purpose of the map.
Map Standards • Scale is defined as the relationship between the distance on the map and the distance on the ground. • a) Usually expressed as a fraction or ratio. • b) 1/10,000 or 1:10,000 • A scale of 1:10,000 means that one unit on the map equals 10,000 of the same units on the ground.
Map Standards-cont. • The first number always represents the map and the second number the ground. • a) The larger the second number is, the smaller the scale of the map. • b) Example: a map of an area 100 miles by 100 miles drawn at a scale of 1:63,360 (1 inch = 1 mile) would be eight feet square. • c) If the same area was drawn with a scale of 1:316,800 (1 in = 5 miles) the map would be less that 2 ft by 2 ft. • d) If the 1:63,360 scale is used but the area is reduced to 20 miles by 20 miles the size of the map would be less than 2 ft by 2 ft.
Map Standards--cont. • The scale of the map is determined by the size of the area and the desired detail. • If the area is large, it is a common practice to use one map with a large scale to show the entire area and other maps with much lower scale to show the details of certain areas. • Companies and government agencies may have a standard scale for all of their maps. • USGS and Forest service commonly use a scale of 1:24,000 • With this scale, each map represents 7.5 minutes of latitude and 7.5 minutes of longitude. • These maps are called 7.5 minute quadrangles.
Map Symbols • Symbols are used for many features on a map to reduce the amount of words. • Several standards have been adopted.
Topo Symbols--cont. For more information on topo symbols go to: http://egsc.usgs.gov/isb/pubs/booklets/symbols/
Accuracy • Topo maps are usually not considered to be extremely accurate. • Their primary function is for planning purposes. • Not intended to show every small depression or hill. • Most measurements can be taken with an accuracy less that the least count of the instrument.
Accuracy--cont. • Standards • Elevations: nearest 0.1 feet • Exceptions are features such as foundations, bridges, sidewalks, etc. that might be used for a benchmark. • These should be to 0.001 feet. • Distances: nearest 0.1 feet • Horizontal angles: nearest degree • Vertical angles for stadia: least count of instrument
Sources of Error & Mistakes In Topographic Surveys • Errors • Instrument errors • Reading errors • Inadequate control points • Exceeding instrument sight distance • Poor selection of stations • Mistakes • Unsatisfactory equipment • Failure to set equipment correctly • Too few, or too many stations • Omission of topographic details. Elementary Surveying, Wolf & Brinker
Map Features • Contour Lines • Contour lines are lines of constant elevation. • Major topographical features 1. Stream beds 2. Hill tops 3. Ridge lines 4. Edge of cliffs 5. Shore lines • Etc.
Map Features-cont. • The edge, centerline and intersection of roads, dams etc. • The beginning or ending points of bridges, culverts and other major road structures. • All known socio-graphic features. • a) City limits • b) County lines • c) Housing districts boundary lines
Map Features--cont. • Utility lines 1. Underground pipe 2. Underground electrical 3. Over head electrical 4. Sewers 5. Storm drains 6. Etc. • Easements • Spot elevations • Any additions features which will enhance the readers ability to read and use the map for its intended purpose.
Definition A contour line is a line that passes through points having the same elevation.* A contour line is represented in nature by a shore line. *Surveying, 10ed, Moffit & Bossler
Elevation from Contours Elevations of points between contours can be determined by interpolation.
Slope from Contours The percent slope can also be determined from the contour lines on a topo map. Determine the slope between the two points on the map. Rise = 200 - 150 = 50 ft Run = 2.625 in x 1,000 ft/in What would be the slope if the map scale is 1:10,000?
Eleven (11) characteristics of contour lines • Contour lines are continuous. • Contour lines are relatively parallel unless one of two conditions exists. • A series of V-shape indicates a valley and the V’s point to higher elevation. • A series U shape indicates a ridge. The U shapes will point to lower elevation. • Evenly spaced lines indicate an area of uniform slope.
Contour Line Characteristics-cont. • A series of closed contours with increasing elevation indicates a hill and a series of closed contours with decreasing elevation indicates a depression. • Closed contours may be identified with a +, hill, or -, depression. • Closed contours may include hachure marks. Hachures are short lines perpendicular to the contour line. They point to lower elevation.
Contour Line Characteristics-cont. • The distance between contour lines indicates the steepness of the slope. The greater the distance between two contours the less the slope. The opposite is also true. • Contours are perpendicular to the maximum slope. • A different type of line should be used for contours of major elevations. For example at 100, 50 and 10 foot intervals. Common practice is to identify the major elevations lines, or every fifth line, with a bolder, wider, line.
1. Contours are Continuous • Some contour lines may close within the map, but others will not. • When they do not close they will start at a boundary line and end at a boundary line.
1. Continuous Contours-cont. • No • Contour 1040 is very unlikely • This would only occur if there were a long vertical wall. Is the topo map correct?
2. Contour lines are parallel • Two exceptions: • They will meet at a vertical cliff • They will overlap at a cave or overhang. 3. When contour lines overlap, the lower elevation contour should be dashed for the duration of the overlap.
3. Valleys and higher elevation A series of V-shapes indicates a valley and the V’s point to higher elevation.
4. U shapes and ridge A series of U shapes indicates a ridge. The U shapes will point to lower elevation.
5. Contour Spacing Evenly spaced contours indicate an area of uniform slope. Unevenly spaced contours indicates an area with variable slope.
6. Hills and Depressions A series of closed contours with increasing elevation indicates a hill. Hills may be identified with a “+” with the elevations
6. Hills and Depressions--cont. • A series of closed contours with decreasing elevation indicates a depression. • Depressions may be identified with a “-”.
8. Hachures • Hachures are short lines which are perpendicular to the contour line. • Used to indicate a hill or a depression. • Not used on modern maps.
9. Contour Spacing • Contours spaced close together indicate a higher % slope. • Contours spaced wider apart indicate lower % slope.
9. Contour Spacing--cont. Contours are perpendicular to maximum slope. • Different types of lines should be used for contours of major elevations. • Common practice is to identify the major elevations lines, or every fifth line, with a bolder, wider, line.
Another decision that must be made is the contour interval. • The “best” interval depends on the use of the data. 9. Contour Spacing-Intervals
Two Issues On Data Collection When collecting topo data there are two important issues: • Ensuring sufficient data is collected to define the object. • Ensuring two types of information is gathered for each station: • Location • Elevation
Defining an Object • It is important to remember that topographic surveys are three dimensional. • To accurately represent an object on a topo map data must be collected to define the shape, location and changes in elevation for an object.
Defining An Object-Hills and Depressions How many stations are required to define the shape of a hill or depression? 17 ? 20 ?
Defining An Object-Ditches Another situations that requires some thought is how many stations are required to define the cross section of a ditch and length of a ditch. Trapezoidal cross section = minimum of 6 Entire ditch = ?? 19
Both location and elevation data must be collected for each station. The two common locating methods are: Triangulation Trilateration Triangulation establishes locations by using angles or a combination of angles and distances. Trilateration establishes locations by using three (3) distances. Station Information
Station Information-cont. These principles establish the two common topographical methods: • Grid • Angle and distance.
Triangulation • Triangulation locates a point by using angles or angles and distances. • Common methods are: • One angle and the adjacent distance • Two angles and one distance • One angle and the opposite distance • One distance and the right-angle offset distance (grid) • Two angles from the point to be located to three control points.
1. Location by Angle and distance • In this method The location of stations A & B is known and the line A:B is the base line. • The instrument is set up over either station A or B and the the angle and distance is measured to X.
Angle and Distance-cont. • The distance can be measured by chaining, stadia, EDM or odometer wheel depending upon the desired precision. • The precision of the angle measurement should match the precision for distance. For example, if stadia measuring to 0.1 ft, is used for distance, the angle measurement precision should be at least minutes.
2. Two Angles & One Distance • In this method a base line is established and the distance A:B is measured. • Angles are turned to the unknown point from two stations along the base line.
3. One Angle & The Opposite Distance • In this method the distance A:B is established on the base line. • The distance A:C is measured. • An instrument is set up at station B and the angle ABC is recorded.
4. One Distance & Right Angle Offset • This method is not practical for locating an existing station. • It is useful for establishing a station. • The distance A:B is established on the base line. • An instrument is set up at station B and a 90 degree angle is turned towards point C. • The desired distance for B:C is measured along the line established by the angle.
5. Two Angles From Three Control Points • This method is very popular for establishing a new station or determining the location of a station because it does not require measuring distances. • Stations A, B & D are control points. • Stations of known location and elevation. • The instrument is set up on C. • One station is used as the backsight and angles are turned to the other two control points.
Trilateration • Trilateration uses three distances to locate or establish a station. • In the illustration the line A:B is the base line and A:C and B:C are measured distances.
Station Identification • In the grid method, rows and columns are identified by letters and numbers. • Angle and distance stations are labeled by letters or numbers or any combination that organizes them in an easy to understand sequence.