Download
1 / 9
90 likes | 282 Views
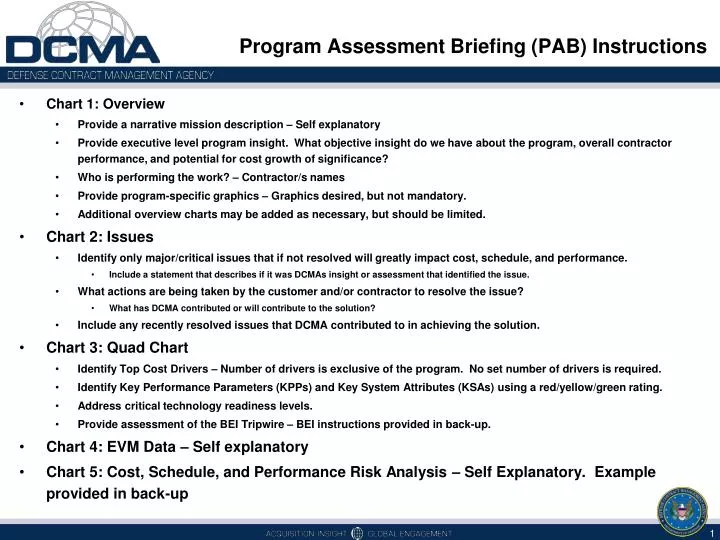
Program Assessment Briefing (PAB) Instructions. Chart 1: Overview Provide a narrative mission description – Self explanatory

E N D
Program Assessment Briefing (PAB) Instructions • Chart 1: Overview • Provide a narrative mission description – Self explanatory • Provide executive level program insight. What objective insight do we have about the program, overall contractor performance, and potential for cost growth of significance? • Who is performing the work? – Contractor/s names • Provide program-specific graphics – Graphics desired, but not mandatory. • Additional overview charts may be added as necessary, but should be limited. • Chart 2: Issues • Identify only major/critical issues that if not resolved will greatly impact cost, schedule, and performance. • Include a statement that describes if it was DCMAs insight or assessment that identified the issue. • What actions are being taken by the customer and/or contractor to resolve the issue? • What has DCMA contributed or will contribute to the solution? • Include any recently resolved issues that DCMA contributed to in achieving the solution. • Chart 3: Quad Chart • Identify Top Cost Drivers – Number of drivers is exclusive of the program. No set number of drivers is required. • Identify Key Performance Parameters (KPPs) and Key System Attributes (KSAs) using a red/yellow/green rating. • Address critical technology readiness levels. • Provide assessment of the BEI Tripwire – BEI instructions provided in back-up. • Chart 4: EVM Data – Self explanatory • Chart 5: Cost, Schedule, and Performance Risk Analysis – Self Explanatory. Example provided in back-up
Provide a narrative mission description Provide executive level DCMA program insight Who is performing the work Provide program-specific graphics [Program Name] Overview (Chart 1) Example Pre-Decisional / For Official Use Only
[Program Name] Issues (Chart 2) Pre-Decisional / For Official Use Only
[Program Name] Quad (Chart 3) Top Cost Drivers Performance (KPPs & select KSAs) • A, % of program cost • B , % of program cost • C , % of program cost • D , % of program cost • E , % of program cost KPP 1 KPP 2 KPP 3 KSA 1 G Y G R N T O N – no capability T – Threshold O - Objective Technology Readiness Assessment Baseline Execution Index (BEI) Pre-Decisional / For Official Use Only
[Program Name]: [Contract #] (Chart 4) Contract Variance Contract Performance • Current contract execution status (e.g., type of contract, percent complete, etc.) • Explanation of the Earned Value Management (EVM) data, e.g., why is it trending like it is, what WBS elements are of concern • Status of recent or planned Integrated Baseline Reviews (IBRs) • Any known deficiencies in the contractor’s EVM systems Pre-Decisional / For Official Use Only
[Program Name] Risk Summary (Chart 5) 5 4 3 2 1 • Risk: • Driver: • Mitigation: • Date: • Risk: • Driver: • Mitigation: • Date: Likelihood 1 2 3 4 5 Consequence • Risk: • Driver: • Mitigation: • Date: Pre-Decisional / For Official Use Only
EFV RISK SUMMARYAPR 10 Example • PERFORMANCE • Risk: Reliability KPP will not be met at IOT&E. • Driver: Lower than expected reliability during previous OA. Design changes flowing from Design For Reliability (DFR) will not be significant enough to provide needed improvement in reliability growth potential. • Mitigation: Achieve KP-2 using SDD-2 vehicles. • Date: Jan 11 • SCHEDULE • Risk: Schedule to MS C will not be maintained. • Driver: Technical and software issues delaying Functional Integration and Acceptance testing along with a tight DTIII schedule may delay start of OA-2. • Mitigation: Providing additional resources to vehicle build and software development to recover schedule. Reviewing developmental test plans to optimize vehicle usage. • Date: Continuous • Risk has moved from 2,4 to 3,4 due to delays in Functional Integration 5 4 3 Likelihood 2 1 • COST • Risk: Redesign of the EFV will result in increased unit costs and increased O&S costs. • Driver: Extension of development for redesign effort. Design For Reliability effort may generate cost growth over that planned. • Mitigation: Challenge contractor to meet specific development cost targets through contract incentive fee provisions (no fee if government projects APBA cost deviation). • Date: Continuous 4 1 2 3 5 Consequence • PERFORMANCE • Risk: EFV LRIP design will not meet its weight requirement. • Driver: Reliability growth initiatives will increase weight beyond threshold requirement. Potential redefinition of Infantry load requirements by MCCDC will increase embarked weight. • Mitigation: Aggressive weight management throughout SDD-2 and LRIP. PM AAA working with MCCDC on load requirements. • Date: Continuous • Risk moved from 3,4 to 2,4 due to improvements in weight margin contained in latest weight report deliverable from GDAMS. Pre-Decisional-For Official Use Only
Baseline Execution Index (BEI) • Baseline Execution Index (BEI): • The Baseline Execution Index (BEI) metric is used to indicate the efficiency with which actual work has been accomplished when measured against the baseline • Example: • Through August 2006 the supplier network schedule shows • 1,955 total tasks/activities to have been completed from • contract start through the current reporting period; 1,516 total tasks/activities have actually been completed • Cumulative BEI = 1,516 Actual / 1,955 Baseline = 0.78 efficiency through the current reporting period • In this example, the BEI of 0.78 falls well below 1.00 indicating a considerable portion of the program schedule is not being completed as originally planned. Through the current reporting period, the actual rate of completing 1,516 tasks/activities or 78% of all work planned indicates 22% of work planned to be completed has been deferred to future periods.