Download
1 / 38
380 likes | 590 Views
Mutual Funds. Basics Types Costs Performance Recent Developments. Basics. What is a Mutual Fund? Financial intermediaries that invest on behalf of individual investors Why Mutual Fund? Diversification and divisibility Fractional shares yet many different securities

E N D
Mutual Funds Basics Types Costs Performance Recent Developments
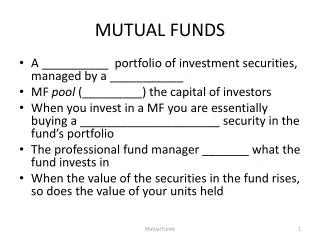
Basics • What is a Mutual Fund? • Financial intermediaries that invest on behalf of individual investors • Why Mutual Fund? • Diversification and divisibility • Fractional shares yet many different securities • Professional management • Portfolio managers and security analysts • Lower transaction costs • Large block trade, reduced commissions and fees • Record keeping and administration • Status report about distribution, dividends, etc.
Basics • Net Asset Value (NAV) • A basis for valuation of shares in investment companies • Same as an open fund’s market value Assets Individual investors Investment company Assets Liabilities Shares
Basics • An Example • A mutual fund manages a portfolio of securities worth $120 million. It owes $4 million to its investment advisors and another $1 million to various suppliers of office products. The fund has 5 million shares. What is the Net Asset Value? • Answer
Types: Open-End Funds • Managed investment company • Investors can invest/divest in the fund by cashing in/out at NAV (at the day’s closing prices) • Market price = NAV: sold at par • Dominant type of investment: over 90% • Assets under management: nearly $12 trillion by 2011 Assets Individual investors Fund’s board of directors Management company Assets Liabilities Redeemable shares
Types: Investment Policies • Money market funds • Specializing in money market securities • Equity Funds • Fixed Income Funds • Treasury, corporate, high yield bonds Capital appreciation Maximum Capital Gains Growth Growth and Income Risk Income Current income Income and Security
Types: Investment Policies • Balanced and Income Funds • Fixed % equities and fixed-income securities • Asset Allocation Funds • Variable % equities and fixed-income securities • Market timers • Specialized Sector Funds • Internet, biotech, pharmaceuticals, etc. • Index Funds • Tracking S&P500, DJIA, etc. • Global Funds • Invest in securities of other countries
Open-End Funds – Strategies • Can not use leverage • Can not use short sales • Can not use fast turnover • Must receive less than 30% of the gross income from the sale of securities held less than 3 months • What can they do?
Costs: Sales Load • Front-end load (“entrance fee”) • A commission or sales charge • Not to exceed 8.5% • Low load funds: 1-3% • Back-end load (“exit fee”) • A redemption fee • Contingent deferred sales charges • 5-6% with 1% sliding down per year
Costs: Operating Expenses • Administrative expenses • Investment advisory fees • Range from 0.2% to 2% of asset value • 12b-1 charges • Commissions to brokers, distribution costs • Up to 1% • Payment of expenses • No explicit bill for operating expenses • Automatic deduction from fund assets
Costs: Example • $10,000 each invested in fund A, B, C. Each fund has 12% before-tax return out of which 5% is dividend yield. How much money you have in each fund after a year? • Results • A: $10,000×[1+(.12–.005)] = $11,150 • B: $10,000×[1+(.12–.01–.005)]= $11,050 • C:(10,000–800)×[1+(.12–.005–.08×.05)]=$10,221 • Dividend reinvestment subject to front-end load
Taxation • “Pass-through” Status • Investors responsible for paying taxes • Investors lose tax-timing options • Turnover rate • Ratio of total trading volume to asset value • Higher turnover ratio, higher tax liability • E.g. e-Tech fund has asset value of $100 million, over the last year. It sold $60 million of old stocks and bought the same amount of new stocks. What is the turnover ratio? • Turnover ratio = 60/100 = 60%
Taxation • Example • An investor’s asset is $1M. In the year, he sells 1K shares of Microsoft at $80, and 2K shares of Ford at $40. He then buys 1.6K shares of IBM at $100 • What’s the portfolio’s turnover rate? • If the purchase price for Microsoft and Ford are $70 and $35, and the investor has 28% tax rate, what’s his tax liability? • Answer: • Trading volume = 1,000×80+2,000×40=$160,000 • Turnover rate = Trading vol./Asset = 160,000/1MM=16% • Profit = 1,000×(80-70)+2,000×(40-35)=$20,000 • Tax = 20,000×28% = $5,600
Closed-End Funds (CEFs) • Managed investment company • Investors invest/divest in the fund by buying/selling the company shares Assets Individual investors Fund’s board of directors Management company Assets Liabilities Non-redeemable shares Exchange listed
CEFs - NAV vs. Price • Market price of shares on an exchange is determined by • relative supply and demand of shares on the market • general market and economic conditions • other factors beyond our control • Market price of CEF shares could be at, above, or below their NAV? • Closed-End Fund Puzzle • IPO price > NAV: sold at premium • Secondary market price < NAV: sold at discount
CEFs – Issuers and Resources • CEFs are issued or sponsored by many financial companies, e.g. • BlackRock • Eaton Vance • ING • Nuveen • PIMCO • Vanguard • http://www.cefconnect.com/ – comprehensive CEF resource site sponsored by Nuveen Investments
Example: Nuveen New York Performance Plus Municipal Fund • Nuveen New York Performance Plus Municipal Fund is a closed-end, diversified management investment company. The Fund seeks current income exempt from regular Federal as well as New York State and New York City income tax. • The Fund may engage in financial futures and options in order to hedge its portfolio. • The Fund may leverage up to 35% of its capital through the issuance of preferred stock. This fund uses leverage to seek to enhance the income produced for common shareholders through the issuance of short-term preferred shares. The proceeds from the sale of the preferred shares can be used to purchase additional long-term bonds. • This fund is composed of quality municipal bonds - those rated investment grade (BBB/Baa or better at the time of purchase) by either Moody's Investor Service or Standard & Poor's Corporation, or those found by fund's investment adviser to be of equivalent credit quality. • This fund is designed to pay monthly dividends free from regular federal and state income taxes. • Dividends can be reinvested automatically. There may be a nominal charge associated with reinvestment. • Shareholders who choose not to reinvest will receive monthly dividend checks, and will also receive a check for any capital gains distributions. • This fund is actively managed with no fixed term.
Example: Nuveen New York Performance Plus Municipal Fund • Portfolio Manager: Scott Romans • NYSE Symbol: NNP • NASDAQ Symbol: XNNPX • Cusip Number: 67062R104 • Inception Date: 11/16/1989 • Inception NAV: $14.05 • Inception Share Price: $15.00 • Total Net Assets as of 12/6/2013: $310.293M • Share Price as of 12/6/2013: $13.03 • NAV as of 12/6/2013: $14.70 • Premium/Discount as of 12/6/2013: -11.36%
Open-End vs. Closed-End Funds Key Differences • Shares Outstanding • Closed-end: No change unless new stock offered • Open-end: Changes when new shares are sold or old shares are redeemed • Pricing • Open-end: Fund share price = NAV • Closed-end: Fund share price may trade at premium or discount to NAV
Mutual Fund Resources • Prospectus • Investment objectives and policies • Fee structure • Morningstar (web or Fund Sourcebook) • Yahoo Finance (market data => mutual fund) • Performance • Expense ratio • Minimal initial investment • Turnover rate • Manager • Top holdings
Performance • How well mutual funds fare? • Evidence • On average, equity fund outperforms money market as compensation for investment risk. • Benchmark: Wilshire 5000, S&P500, etc • You can buy and hold index at very low cost (~18bp) • Vanguard S&P 500 or Total stock market fund • Risk adjustment: beta risk, factor risk, etc • Higher return does not mean a fund is better, risk has to be factored in to evaluate a fund performance.
Performance • Historical comparison (1980 - 2005)* • S&P 500 – 12.3% average yearly return • Average Mutual Fund - 10% average yearly return • Historical comparison (1971 - 2010)** • Wilshire 5000 – 10.3% average yearly return • Average Mutual Fund return was 0.8% lower than Wilshire 5000 • Consensus: passive equity fund (indexed) outperforms active managed funds ** BKM, 9th ed. * The Economist, Feb 28, 2008
Performance – Hot Hands • Hot Hands • Generally mixed evidence • What do we learn from the exceptions? • Warren Buffet • Peter Lynch • George Soros
Persistence of Mutual Fund Performance Carhart (1997, JF) - not much of a long term persistence!
Other Investment Organizations • Hedge Funds • Private speculative investment pool, exempt from SEC regulation • Unit Investment Trusts • Money pooled from many investors is invested in portfolio fixed for life of fund • Commingled Funds • Partnership of investors pooling funds; designed for trusts/larger retirement accounts to get professional management for fee • Real Estate Investment Trusts (REITs) • Similar to closed-end funds, invests in real estate/real estate loans
Hedge Funds • Strategies • No restrictions • Objectives • Arbitrage • To achieve absolute returns • Usually market-neutral (market-hedged) positions • Check this out: • www.hedgeindex.com
Unit Investment Trusts • Pools of money invested in a portfolio that is fixed for the life of the fund • Who are they? • Fixed-income portfolios (90% of UITs) • Tax-exempt debt portfolios (90% of fixed-income portfolio) • Unmanaged funds (e.g. SPDR or “Spider”) Assets Sponsor Brokerage Company Individual investors Assets Trust Liabilities Redeemable trust certificates
Unit Investment Trusts • What’s in for the sponsors • Sell trust shares at a premium over NAV • An Example • A trust purchases $5 million of assets. It then sells 5,000 shares to the public at a price of $1,030 per share. What is the premium? • Answer
Recent Developments - ETFs • Exchange-Traded Funds (ETFs) • Funds that allow investors to trade index portfolios • Examples: • “Spiders,” “Diamonds,” and “Cubes” • Spiders - the first index ETF started in 1993 • iShares by BlackRock • Market Vectors by Van Eck Global
ETFs – Pros and Cons • Potential Advantages • Trade continuously throughout day like stocks • Can be sold short or purchased on margin • Lower costs (no marketing, lower fund expenses) • Potentially lower tax rates • Potential Disadvantages • Small deviations from NAV possible • Brokerage commission to buy ETF
Where are We Now? • Investment Company Assets Under Management, 2011 ($ Billion)