Download
1 / 26
270 likes | 394 Views
MERIS FAPAR: Towards Phenology Products . Nadine Gobron, Jan Musial, Michel Verstraete and Wolfgang Knorr. MERIS/ENVISAT. Passive optical instrument of Earth Observation Primary mission: Ocean productivity Secondary missions: Atmosphere and land surface characterization

E N D
MERIS FAPAR: Towards Phenology Products Nadine Gobron, Jan Musial, Michel Verstraete and Wolfgang Knorr.
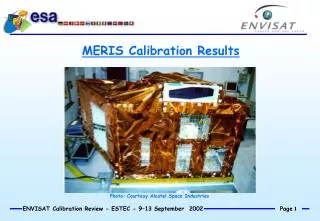
MERIS/ENVISAT • Passive optical instrument of Earth Observation • Primary mission: Ocean productivity • Secondary missions: Atmosphere and land surface characterization • Ground segment support (up to L2) • Global coverage: ≤ 3 days (depends on latitude) • Swath: 1150 km • Spatial resolution: ± 300 m (FR) & ± 1200 m (RR) • Spectral band positions, widths and gains are programmable • Radiometric and spectral calibration on-board mechanisms (white & pink Spectralon, Fraunhofer lines) Source: http://envisat.esa.int/instruments/meris/
Dahra semi-arid grass savannah Ref: Fensholt et al. 2004 FAPAR ≈ 1.-exp(-G(µ0)<LAI>/µ0) <LAI> from PCA_LICOR Harvard Ref: Turner et al. 2005 FAPAR ≈ 1.-exp(-0.58<LAI>)<LAI> from PCA_LICOR Advanced procedure for spatio-temporal changes of local LAI Validation of JRC- FAPAR conifer/broad-leaf forest
Phenological Indicators DataAnalysis Two Roads FAPAR Phenological Parameters Process Model
Carbon cycle data assimilation using satellite-derived FAPAR and a revisited phenology scheme for global applications Wolfgang Knorr (1), Thomas Kaminski (2), Marko Scholze (1), Bernard Pinty (3,5), Nadine Gobron (3), Ralf Giering (2), and Pierre-Philippe Mathieu (5) (1) Dept of Earth Science, University of Bristol, UK, (2) FastOpt GmbH, Hamburg, Germany, (3) European Commission, DG Joint Research Centre, Institute for Environment and Sustainability, Global Environment Monitoring Unit, Italy, (4) European Space Agency, ESRIN, Frascati, Italy, (5) Seconded to the Earth Observation Directorate, ESA-ESRIN, Frascati, Italy
Challenges: Satellite FAPAR data through an appropriate model provide an indirect constraint on carbon and water fluxes. Predictive models of the terrestrial biosphere are needed that simulate FAPAR, water and carbon fluxes. This requires a (sub-) model of leaf phenology of all major global biomes. Challenge is to design a terrestrial model such that: its process parameters can be estimated by means of a gradient-based optimisation algorithm, which requires smooth dependency on process parameters it satisfies simultaneouslymultiple observational constraints Using Cycle Data Assimilation System • Revised original phenology scheme to render the model suitable for gradient-based optimisation (e.g. avoid sudden changes of leaf status by allowing spatial variability within a grid cell). • Assimilation of MERIS FAPAR product at seven sites simultaneously. • A single set of process parameters to match observations over all sites composed of a mix of seven Plant Functional Types (PFTs). • Optimization of : - 14 parameters related to phenology - 24 related to photosynthesis - not all are PFT specific [LAImax] - additional parameters with no impact on FAPAR [Q10] W. Knorr et al, 2010, ‘Carbon cycle data assimilation with a generic phenology Model’, JGR, revised.
x x x x x x The selected sites Dotted: prior; solid line: posterior FAPAR; crosses with error bars: MERIS FAPAR. W. Knorr et al, 2010, ‘Carbon cycle data assimilation with a generic phenology Model’, JGR, revised.
Assessment of Phenology FAPAR Phenological Indicators DataAnalysis Phenological Parameters Process Model
Missing data in the FAPAR record instrument problems lack of solar radiation (at high latitude in the winter) clouds snow and ice Noise in remote sensing products radiometric accuracy navigation and pointing accuracy Unexpected or extreme events fire Growing seasons (GS) may start and end on quite different dates each year may occur more than once per year may straddle 2 calendar years (e.g., Southern Hemisphere) may not be synchronous over large areas may start before or end after the period of observation Challenges
Gap-filling and noise reduction • Four gap-filling methods have been tested using 10-days FAPAR products: • Kondrashov and Ghil (2006) based on Singular Spectrum Analysis (SSA). 3 steps: decomposition, grouping and reconstructing • Smoothing Spline from Reinsch (1967) ‘provides nice curves from discrete, noisy data’ (Craven, Wahba, 1979). • Lomb-Scargle Periodogram Hocke and Kampfer (2009) to construct the complex Fourier spectrum (Hamming window). • Same as 3 but with Kaiser-Bessel spectral window. Musial et al., 2010, ‘Comparison of algorithms for gap-filling and noise reduction of a noisy, unevenly sampled time series ’, in preparation.
Gap-filling and noise reduction oops Hainich Site -10 days - 1 x 1 pixel Musial et al., 2010, ‘Comparison of algorithms for gap-filling and noise reduction of a noisy, unevenly sampled time series ’, in preparation.
Missing data in the FAPAR record instrument problems lack of solar radiation (at high latitude in the winter) clouds snow and ice Noise in remote sensing products radiometric accuracy navigation and pointing accuracy Unexpected or extreme events fire Growing seasons (GS) may start and end on quite different dates each year may occur more than once per year may straddle 2 calendar years (e.g., Southern Hemisphere) may not be synchronous over large areas may start before or end after the period of observation Challenges Verstraete M. M., et al. (2008) 'An automatic procedure to identify key vegetation phenology events using the JRC-FAPAR products', Advances in Space Research, Volume 41, Issue 11, Pages 1773-1783.
Methodology Choice of the S-shaped model: • Sine wave, Weibull distribution, logistic function, arc tangent trigonometric function, sigmoid • Mathematical function must be • easy to parameterize to allow ‘local’ fits with variable shapes • continuous and analytically derivable to facilitate use of accelerated optimal fitting procedures • computationally cheap to evaluate (including derivative) • Select the parametric sigmoid: • where • a sets the total amplitude of the curve, • b sets the sign and strength of the slope of the curve, • c sets the horizontal offset of the curve, and • d sets the vertical offset of the curve Verstraete M. M., et al. (2008) 'An automatic procedure to identify key vegetation phenology events using the JRC-FAPAR products', Advances in Space Research, Volume 41, Issue 11, Pages 1773-1783.
Comparing results from different sensors • Results for Moorreesburg, South Africa, in 2003. SeaWiFS MERIS MODIS Verstraete M. M., et al. (2008) 'An automatic procedure to identify key vegetation phenology events using the JRC-FAPAR products', Advances in Space Research, Volume 41, Issue 11, Pages 1773-1783.
Using MERIS 10-days products at global scale from 2003-2009 …. First Test: retrieve decade for which FAPAR is maximum Next steps: apply GLS algorithm for retrieving start and end dates using different ‘shape’ functions and criteria to define statistical properties of phenology. Preliminary Results
Anomaly in Decade Max FAPAR 2009 -20 -15 -10 -5 0 5 10 15 20
MERIS FAPAR products are available since 04/2002 Comparisons of gap-filling algorithms have been done at local scale and can be done to 10-days global products. Through CCDAS approach, a revised original phenology scheme has been proposed by Knorr el al (2010) and first global products show encouraging results. Assessment of phenological parameters at global scale (apply GLS algorithm for retrieving start and end dates using different ‘shape’ functions and criteria to define statistical properties of phenology) Results from these approaches can be compared and benchmarked against ground-based measurements (Collaboration welcome). Summary and Perspective