Download
1 / 9
90 likes | 94 Views
Lesson 31: Using Sampling to Draw Inferences. Essential Question:. What does the data from a random sample tell you about a population?. Word to Know:. Variability – a measure of how much the values in a data set vary from each other or from a measure of center (how spread out the data is)

E N D
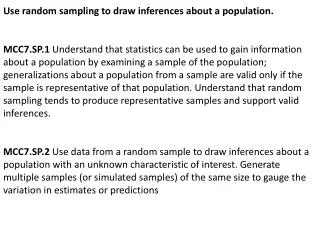
Essential Question: What does the data from a random sample tell you about a population?
Word to Know: Variability – a measure of how much the values in a data set vary from each other or from a measure of center (how spread out the data is) • More spread out – more variability • Closer together – less variability
Problem 1: The data from two random samples of 100 students regarding their lunch preferences are given below. About how many servings of pizza should we order to serve lunch to 1200 students?
Problem 2: Given the data in the table below from a random sample of 5000 registered voters, predict the outcome of the election. What percentage of the voters supports the winning candidate?
Problem 3: The data from two random samples of 200 students regarding their favorite sports are given below. Make inferences about the data and give the percentage of students who prefer basketball.
Problem 4: Random samples show that about 10 % of the population is left handed. How many pairs of left-handed scissors should we have for classes of about 40 students? What about for 6 students? 76 students?
Problem 5: There are 924 students at a middle school. Random samples of students show that about one third attend after-school clubs. How many chairs should be set up for the school-wide Club Day meeting?
Problem 6: The operators of the PlayPlace amusement park want to know how many first-time visitors plan to visit the park again in the next year. They take random samples of 600 first-time visitors as they exit the park asking them: “When do you plan to visit again?” The results are below. PlayPlace has 720,000 first time visitors each year. Based on these samples above, about how many visitors each year plan to visit the park again in the next year?