Download
1 / 29
290 likes | 407 Views
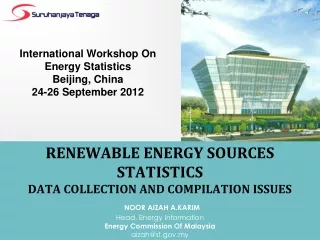
International Workshop on Energy Statistics. Beijing, China, 24-26 September 2012. Area 261228 Square Mile. Population 59.13 million on 2009-2010. Population growth rate 1.29% (2009-2010). MINISTRY OF NATIONAL PLANNING AND ECONOMIC DEVELOPMENT. Gas Statistics in Myanmar.

E N D
International Workshop on Energy Statistics Beijing, China, 24-26 September 2012.
Area261228 Square Mile Population 59.13 million on 2009-2010 Population growth rate 1.29% (2009-2010)
MINISTRY OF NATIONAL PLANNING AND ECONOMIC DEVELOPMENT Gas Statistics in Myanmar. Presented by Phyu Phyu Khin Than Assistant Director Central Statistical Organization
ORGANIZED AS CENTRAL STATISTICAL ORGANIZATION (CSO) IN FEBRUARY 1974 • STATISTICAL ACT • Central Statistical Authority Act No. 34, 1952
PRIME OBJECTIVES OF CSO • Collecting, Compiling, Conducting Analyzing and Presenting Social and Economics Data • provide relevant, timely, reliable and comprehensive information on vital aspects of Myanmar society • 3. build and maintain official statistics of high integrity quality • 4. build upon the trust that international agencies, governments, communities and individuals have in all information, enhancing CSO’s capability • 5. maintain the cooperation of data providers and increase the usage and user understanding of official statistics.
DATA COLLECTIONS SYSTEM • Data has been collected into (3) ways; • Obtaining data as a by products of routing administrative records. • Collecting data in collaboration with concerned government department. • Conducting Sample Surveys by CSO itself.
MYANMAR STATISTICAL SYSTEM • Decentralize • Every ministry compile own data independently
Myanmar Standard Industrial Classification of Revision Four(MSIC, Rev-4) • The (MSIC, Rev-4) has been built based on (ISIC, Rev-4) published by United Nations Statistics Division (UNSD). The present (MSIC, Rev-4) will cover on all economic activities generally. it will be consistent with the frame work of System of National Account’s calculation. Some economic activities (5- digits code) cannot be found at the present in Myanmar but it should be put for future development.
The present (MSIC, Rev-4) consists (21) sections, (88) Divisions, (238) Groups, (466) Items and (1321) Industries (5 digits code for Myanmar Economic Sectors) respectively. • The tabulation categories, identified by letters, are called ‘sections’, the 2-digit categories ‘divisions’, the 3-digit categories ‘groups’ and the 4-digit categories ‘classes’. • (MSIC, Rev-4) is intended to be a standard classification of productive activities. It is not designed to measure product data at any detailed level. For this purpose, a separate classification, namely, the Central Product Classification (CPC) is needed to prepare to fit Myanmar products.
The man who are working economic activities and statistical data collection (or)organizations by applying according to the classifications of the present (MSIC, Rev-4), it will be not only more convenient and facilitate to compare economic and social conditions by regions, by country and internationally but also better provide to a need of applying on SNA-2008 in GDP calculation of the country.
Data Collection and Compiling • We compile Gas Statistic from Energy Planning Department, Customs Department. Production of Gas
Production of Natural Gas & Liquefied Petroleum Gas of The State Economic Enterprises
Products of Natural Gas by two ways are pipeline and compressed. In April 2012, production of Natural Gas by pipeline is 27331.20 (Million Cu ft). In May 2012, is 37780.25(Million Cu ft) and 40618.68 (Million Cu ft) is in June. In April 2012, Production of Natural Gas by Compressed is 517.00 (Million Cu ft), 591.35 (Million Cu ft) is in May and 561.69 (Million Cu ft) is in June 2012, total production of Natural Gas is 41180.37 (Million Cu ft) up 7.3 percent over May and in May 2012, product of Natural Gas is 38371.60 (Million Cu ft) up 37.8 percent over the April 2012.
In 2010-11, production of Natural Gas by pipeline is 443341 (Million Cu ft), up 2.4 percent over the previous year 2009-10 and in 2009-10, 432951 (Million Cu ft), up 8.4 percent, over the previous year 2008-09. Generally the share of pipeline Gas in total production is 98 % and 2 % is by compressed. In 2010-11, production of Natural Gas by Compressed is 7040.37 (Million Cu ft), up 1.6 percent over the previous year 2009-10 and in 2009-10, 666.85 (Million Cu ft), up 5.7 percent, over the previous year 2008-09.
Production of Liquefied Petroleum Gas has got from three Industries . There are - (1)Thanhlin Petroleum Industry (2)Than Paya Kan Petroleum Industry (3) Liquefied Petroleum Industry In 2010-11, Liquefied Petroleum Gas is 3290 thousand gallon increased by 2.8 % over the previous year 2009-2010 and 2009-2010, Petroleum Gas is 3200 thousand gallon decreased by 17.2 % over the previous year 2008-2009.
Investment in Myanmar 18 18
Currently, there are 485 the total permitted enterprises from 31 countries that have been investing a great deal of money in Myanmar. Their total amount of investment is 41086.957 million dollars in July 31st 2012. Up to 31st July 2012, Foreign Trade investment of permitted enterprises of approved amount is 41086.957 million US dollar and most particulars are Power, Oil & Gas and Mining. Approved amount of Power is 19067.498 million US dollar , Oil & Gas is 14181.972 million US dollar and Mining is 2814.360 million US dollar. The share of Power in total approved amount is 46.41 percent, Oil & Gas is 34.52 percent and Mining is 6.85 percent.
Export of Gas Institutional arrangements (1) Agency primarily responsible for IMT Statistics -Central Statistical Organization (CSO)(2) Other agencies with significant statistical roles -Customs Department is responsible for data collection based on Customs Export/Import Declaration Forms providing primary data to CSO.(3) The Central Statistical Authority Act, Act No 34 of 1952 national legislation provides for the collection of the data.
Alignment with international standards(1) General Trade System is used: (2) Export valued on free on board (fob) basis:(3) Import valued on cost, insurance and freight (cif):(4) Export classified by country of final destination:(5) Import classified by country of origin : Exports have been recorded according to the date of completion of consignment. Imports have been recorded as of the date of arrival of goods.
Major classification (1) We used H.S version 2012 from April 2012. The present (Version 2012) consists 21 sections, 98 chapter for 2 digits, 1241 heading for 4 digits, 5019 sub-headings 6 digits(WCO), 517 ASEAN Harmonized Tariff Nomenclature for 8 digits and 526 last 2 digits is statistics code of Myanmar. (2) Country Classification Country classification by geographical country published by UN are used.
Business Processes and Systems The business process and systems used to capture and transform raw data are done by CSO. Monthly : The Customs Department provides raw data to CSO, by Excel files. CSO processes value of exports and imports and Trading partners using Microsoft Access. CSO submits the weekly foreign trade data to the higher authority. Annually: Raw data are transferred to CSO electronic format including 30 data field. Data checking and editing are done by CSO to consistent of data such as, price unit, HS code classification match on the commodities and misclassification of commodities and country. After checking and editing the data, CSO produces the official data in publication.
Gas can be exported through Metric Station after getting license. It can be export gas by the one pipe-line in border-line by joining Yetagon and Yetana pipe lines. The agent of Metric Stations in border off shore the document that sending amount of the unit to the department. The companies finalize every month. The unit of sending gas can be measured MMBTU. MMBTU means British Thermo Unit. Now We will change measure of unit of is Kilogram. The amount of applying of license from companies must be adjusted with Custom department.
It produced gas value, MMBTU and the gas price of every last month to the Ministry of Energy Department. After getting license export declaration from filled up the respective exporters and check by customs officials constitute the source of information in compiles Gas Statistics
In 2011-12, export of gas amounted to 3502.5 million US dollar, up 38.9 percent and in 2010-11, amounted to 2522.5 million US dollar, down 13.8 percent over the previous year. In 2010-12, quantity of gas is 400032.6 million cu-ft, down 2.5 percent and in 2010-11, quantity of gas is 410370.4 million cu-ft, down 17.8 percent over the previous year.
Gas Exports, 2008/09-2011/12 (value in million of U.S dollars: volumes in million cu.ft)
Statistical outputs released - Monthly report: Update the monthly data are published by Selected Monthly Economic Indicators. Website:https://www.mnped.gov.mm - Annual report: Yearly data at CD Rom and book forms released by Statistical Yearbook.