Download
1 / 6
60 likes | 140 Views
Study investigates efficacy of stem cell therapy in ischemic stroke using MRI. Results show clearance of labeled cells and change in stroke volume. Histology confirms cell delivery.

E N D
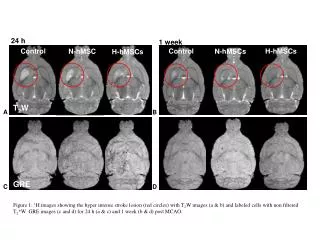
24 h 1 week Control Control H-hMSCs N-hMSC N-hMSCs H-hMSCs T2W A B GRE C D Figure 1: 1H images showing the hyper intense stroke lesion (red circles) with T2W images (a & b) and labeled cells with non filtered T2*W GRE images (c and d) for 24 h (a & c) and 1 week (b & d) post MCAO.
10 h 24 h 1 week Figure 2: A) Percent decrease in signal voids (adjusted fir the average signal voids in the control group) between 24 h and 1 week. Voids corresponding to labeled N-hMSCs or H-hMSCsafter transplantation and ischemic stoke ; B) Nonlocal means filtered T2* GRE images showing clearance of labeled N-hMSCs at three time points: 10 h , 24 h and 1 week.
N=5 N=3 N=5 B A Control N-hMSCs H-hMSCs Control N-hMSCs H-hMSCs Figure 3A: Percent change ADC in stroke lesion. Figure 3B illustrate percent change in ADC on the contralater side. Significance determined with ANOVA and Tukey’s post hoc test (p<0.05)
24 h Control N-hMSCs H-hMSCs A 1 week Control N-hMSCs H-hMSCs B Figure 4: Sodium images showing the stroke lesion as hyperintese(red circle) for each respective group and time point: A) 24 h and B) 1 week.
N=7 N=5 N=5 N=7 N=5 N=5 A B H-hMSCs H-hMSCs Control Control N-hMSCs N-hMSCs Figure 5: Percent decrease in stroke volume based on a) T2W 1H and b) 3D GRE 23Na datasets. Inserts are showing representative images from each respective sequences. Significance determined with ANOVA and Tukey’s post hoc test (p<0.05). n=5 n=7 n=5 n=7 n=5
20x A B Figure 6A: Histology from an animal sacrificed 24 h after cell injection and MCAO and stained with antihuman mitochondria antibody (green) for the hSMCs. Intracellular MPIO particles are red and the nucleus are stained blue with Hoescht stain. Co-localization of hMSCs and particles are evident, proving the delivery of the hMSCs and MRI contrast. Flourescent images are taken at 20x. Figure B show an ex vivo image aquired at 11.75 T (50-mm isotropic resolution) from the same subject with hypointense voids coming from labeled hMSCs. Scale bar is 5 mm.