Download
1 / 31
320 likes | 335 Views
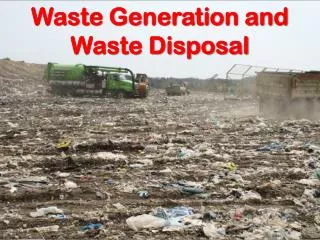
Chapter 16 Waste Generation and Waste Disposal. Humans generate waste that other organisms cannot use. In 1900 in the U.S. virtually all metal, wood, and glass materials were recycled.

E N D
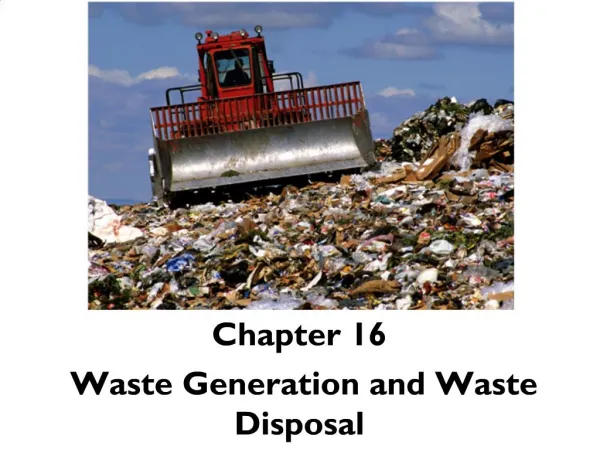
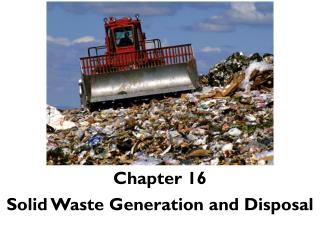
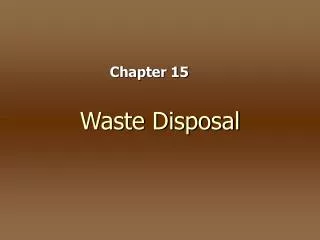
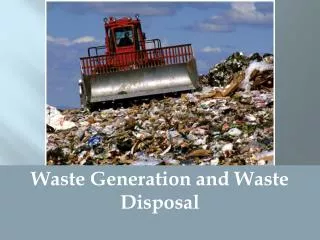
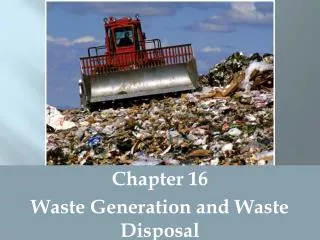
Chapter 16 Waste Generation and Waste Disposal
Humans generate waste that other organisms cannot use • In 1900 in the U.S. virtually all metal, wood, and glass materials were recycled. • After World War II, industrialization brought wealth to may Americans, which made it possible for people to purchase household conveniences that could be used and thrown away. • Municipal Solid Waste (MSW)- refuse collected by municipalities from households, small businesses, and institutions such as schools, prisons, municipal buildings, and hospitals.
Humans generate waste that other organisms cannot use • Figure 16.3 shows municipal solid waste generation in the U.S. between 1960 – 2008. Both total MSW and Per capita MSW increased from 1960 to 2008. Just recently it started to decrease.
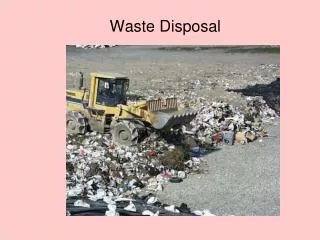
Content of the Solid Waste Stream • MSW is comprised of the things we use and then throw away. The goods that we use are generally a combination of organic items, fibers, metals, and plastics, made from petroleum. • Waste stream – the flow of solid waste that is recycled, incinerated, placed in a solid waste landfill or disposed of in another way.
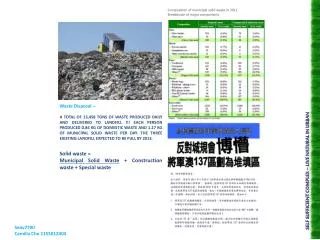
Content of the Solid Waste Stream • Figure 16.4 shows a large dump in Manila, Philippines. Throughout the world, impoverished people scavenge dumps.
Composition of Municipal Solid Waste • Figure 16.5 (a) shows the data for MSW composition in the United States in 2008 by category.
Composition of Municipal Solid Waste • 31% - paper • 33%- organic materials (yard waste, food scraps, wood) • 12%- plastic • 16%- durable goods (appliances, tires) • 8% - rubber, leather, and textiles
E-Waste • Electronic waste or e-waste, is one component of MSW that is small by weight but very important and rapidly increasing. • E-waste includes televisions, computers, portable music players, and cell phones. • E-waste often has heavy metals such as lead, mercury and cadmium.
E-Waste • Figure 16.6 shows electronic waste being recycled in China. Much of the recycling is done without protective gear and respirators that would typically be used in the U.S.
The three Rs Reduce, Reuse, Recycle • Reduce- waste minimization or prevention • Reuse- reusing something like a disposable cup more than once • Recycle- materials are collected and converted into raw materials and then used to produce new objects
The three Rs Reduce, Reuse, Recycle • Closed-loop recycling is the recycling of product into the same product. An example is an aluminum can. This process is called closed loop because in theory, it is possible to keep making aluminum cans from only old aluminum cans. • Open –loop recycling is the recycling of one product such as plastic soda bottles into another product, such as a polar fleece jacket.
The three Rs Reduce, Reuse, Recycle • Figure 16.9 shows total weight of MSW recycled and percent of MSW recycled in the U.S. over time.
The three Rs: Reduce, Reuse, Recycle • Figure 16.10 shows a mixed single-stream solid waste recycling facility in San Francisco, California. With single-stream recycling, also called no-sort or zero-sort recycling, consumers no longer have to separate materials.
Composting • Compost- organic material that has decomposed under controlled conditions to produce an organic-rich material. • Figure 16.11 shows good compost has a pleasant smell and will enhance soil quality by adding nutrients to the soil and by improving moisture and nutrient retention.
Composting • Figure 16.12 shows a municipal composting facility. A typical facility collects almost 100,000 metric tons of food scraps and paper per year and turns it into usable compost.
Currently, most solid waste is buried in landfills or incinerated • Sanitary landfills- engineered ground facilities designed to hold MSW with as little contamination of the surrounding environment as possible. • Leachate- the water that leaches through the solid waste and removes various chemical compounds with which it comes into contact.
Currently, most solid waste is buried in landfills or incinerated • Figure 16.13 shows the fate of municipal solid waste in the U.S. The majority is disposed of in landfills.
Modern Sanitary Landfill • Figure 16.14 shows a landfill constructed today has many features to keep components of the solid waste from entering soil, water table or nearby streams.
Modern Sanitary Landfill • A municipality or private enterprise constructs a landfill at a tremendous cost. These costs are recovered by charging a fee, called a tipping fee. • Tipping fees at solid waste landfills average $35 per ton in the U.S., although in certain regions, such as the Northeast, fees can be twice as much. • These fees create an economic incentive to reduce the amount of waste that goes to the landfill.
Some Problems with Landfills • NIMBY “not-in-my-backyard” idea that landfills are smelly and unsightly. • No matter how careful the design and engineering, leachate can escape and pollute local waterways. • Landfills produce methane and it can be explosive if not handled correctly
Incineration • Incineration- the process of burning waste materials to reduce its volume and mass and sometimes to generate electricity and heat. • Figure 16.16 shows a municipal mass-burn waste-to-energy incinerator.
Incineration basics • Ash – is the residual nonorganic material that does not combust during incineration. • Residue collected underneath the furnace is known as bottom ash and residue collected beyond the furnace is called fly ash. • Disposal of this ash is determined by its concentration of toxic metals. • When heat generated by incineration is used rather than released to the atmosphere, it is known as a waste-to-energy system.
Some Problems with Incineration • Tipping fees for incinerating trash • Releases air pollutants such as organic compounds from incomplete combustion of plastics and metals. • Ash is often toxic and must be disposed of properly. • Incinerators may not completely burn all the waste deposited in them.
Hazardous Waste • Hazardous waste- liquid, solid, gaseous, or sludge waste material that is harmful to humans or ecosystems. • Collection sites for hazardous waste must be staffed with specially trained personnel. • Hazardous waste must be treated before disposal. • According to EPA, there are over 200,000 hazardous waste generators in U.S., producing 36 million metric tons each year.
Hazardous Waste • Figure 16.17 shows a typical household hazardous waste collection site in Seattle, Washington. • Household hazards wastes include oven cleaners, batteries, pesticides and lawn fertilizers.
Laws • Resource Conservation and Recovery Act (RCRA)- designed to reduce or eliminate hazardous waste. Also known as “cradle-to-grave” tracking. • RCRA ensures that hazardous waste is tracked and properly disposed of. • In 1976, the RCRA’s main goal was to protect human health and the environment by reducing or eliminating the generation of hazardous waste.
Laws • Comprehensive Environmental Response, Compensation, and Liability Act (CERCLA)- also know as “Superfund”. • Puts a tax on the chemical and petroleum industries. This revenue is used to cleanup abandoned and non-operating hazardous waste sites where a responsible party cannot be found. • Requires the federal government to respond directly to the release of substance that may pose a threat to human health or the environment.
Laws • Figure 16.18 is a map showing distribution of NPL (Superfund) sites in the U.S. The EPA maintains the NPL of contaminated sites that are eligible for cleanup funds. • National Priorities List (NPL) has more than 1,200 sites throughout the U.S. Most well known NPL site could be Love Canal, New York.
Laws • Figure 16.19 is a picture of Lois Gibb. She became a spokesperson for the neighborhood of Love Canal and is widely credited with bring national attention to her community. • The contamination was so bad that in 1983 Love Canal was listed as a Superfund site and the inhabitants of the area were evacuated. In 1994, after many years of physical clean up, Love Canal was removed from NPL list.
Brownfields • Contaminated industrial or commercial sites that may require environmental cleanup before they can be redeveloped or expanded. • Many brownfields include old factories, industrial areas and waterfronts, dry cleaners, gas stations, landfills, and rail yards.
Integrated Waste Management • A method that seeks to develop as many options as possible, to reduce environmental harm and cost. • Reduction, recycling, composting, landfills, and incineration are some ways IWM is utilized. • The book Cradle to Cradle argues that it is first necessary to assess existing practices in order to minimize waste generation before, during, and after manufacturing.