Download
1 / 13
130 likes | 267 Views
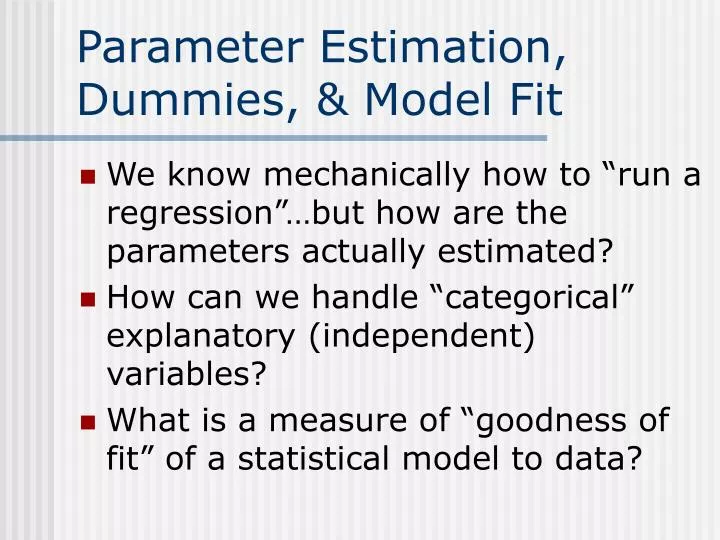
Parameter Estimation, Dummies, & Model Fit. We know mechanically how to “run a regression”…but how are the parameters actually estimated? How can we handle “categorical” explanatory (independent) variables? What is a measure of “goodness of fit” of a statistical model to data?.

E N D
Parameter Estimation, Dummies, & Model Fit • We know mechanically how to “run a regression”…but how are the parameters actually estimated? • How can we handle “categorical” explanatory (independent) variables? • What is a measure of “goodness of fit” of a statistical model to data?
Example: Alien Species • Exotic species cause economic and ecological damage • Not all countries equally invaded • Want to understand characteristics of country that make it more likely to be “invaded”.
Understanding Invasive Species Steps to improving our understanding: • Generate a set of hypotheses (so they can be “accepted” or “rejected”) • Develop a statistical model. Interpret hypotheses in context of statistical model. • Collect data. Estimate parameters of model. • Test hypotheses.
2 Hypotheses (in words) • We’ll measure “invasiveness” as proportion of Alien/Native species (article by Dalmazzone). • Population density plays a role in a country’s invasiveness. • Island nations are more invaded than mainland nations.
Variables • Variables: • Dependent: Proportion of number of alien species to native species in each country. • Independent: • Island? • Population Density • GDP per capita • Agricultural activity
Computer Minimizes Sei2 • Remember, OLS finds coefficients that minimize sum squared residuals • Graphical representation • Why is this appropriate? • Can show that this criterion leads to estimates that are most precise unbiased estimates.
Dummy Variable • Generally: • Male/Female; Pre-regulation/Post-regulation; etc.. • Use a “Dummy Variable”. Value = 1 if country is Island, 0 otherwise. • More generally, if n categories, use n-1 dummies. • E.g. if want to distinguish between 6 continents • Problem: Lose “degrees of freedom”.
A Simple Model • A simple linear model looks like this: • Dummy changes intercept (explain). • Interaction dummy variable? • E.g. Invasions of island nations more strongly affected by agricultural activity.
Translating our Hypotheses • 2 Hypotheses • Hypothesis 1: Population: Focus on a3 • Hypothesis 2: Island: Focus on a2 • “Hypothesis Testing”… forthcoming in course. • Parameter Estimates: Value Std.Error t value Pr(>|t|) (Intercept) -0.0184 0.0859 -0.2141 0.8326 Island 0.0623 0.0821 0.7588 0.4564 Pop.dens 0.0010 0.0002 6.2330 0.0000 GDP 0.0000 0.0000 3.3249 0.0032 Agr -0.0014 0.0015 -0.9039 0.3763
“Goodness of Fit”: R2 • “Coefficient of Determination” • R2=Squared correlation between Y and OLS prediction of Y • R2=% of total variation that is explained by regression, [0,1] • OLS maximizes R2. • Adding independent cannot R2 • Adjusted R2 penalizes for # vars.
Answers • Island nations are more heavily invaded (.0623) • Not significant (p=.46) • Population density has impact on invasions (.001) • Significant (p=.0000) • R2=.80; about 80% of variation in dependent variable explained by model. • Also, corr(A,Ahat)=.89