Download
1 / 1
10 likes | 135 Views
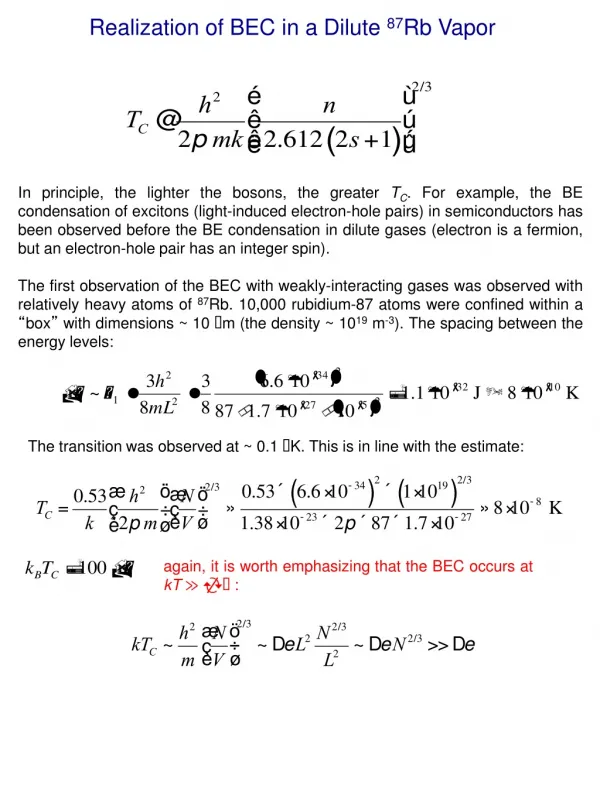
Transverse Measurements of Polarization in Optically-Pumped Rb Vapor Cells J.M. Dreiling 1 , E.B. Norrgard 1 *, D. Tupa 2 , and T.J. Gay 1 1 University of Nebraska, Lincoln, NE 68588 2 Los Alamos National Laboratory, Los Alamos, NM 87545.

E N D
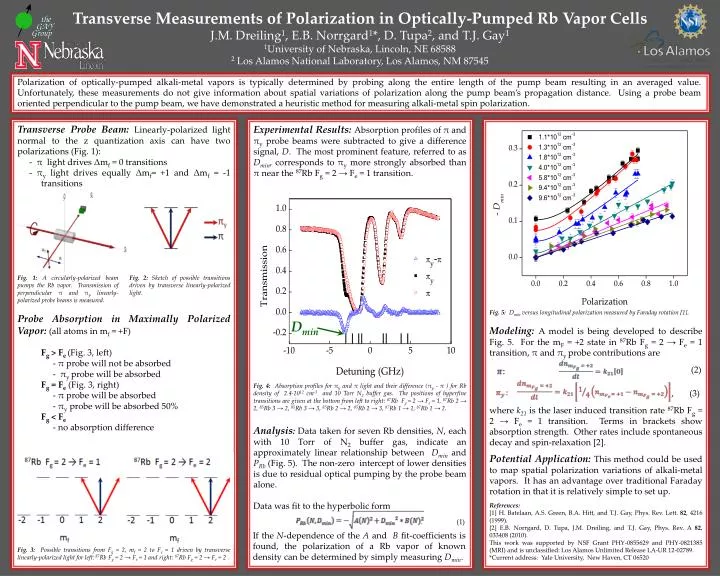
Transverse Measurements of Polarization in Optically-Pumped Rb Vapor Cells J.M. Dreiling1, E.B. Norrgard1*, D. Tupa2, and T.J. Gay1 1University of Nebraska, Lincoln, NE 68588 2 Los Alamos National Laboratory, Los Alamos, NM 87545 Polarization of optically-pumped alkali-metal vapors is typically determined by probing along the entire length of the pump beam resulting in an averaged value. Unfortunately, these measurements do not give information about spatial variations of polarization along the pump beam’s propagation distance. Using a probe beam oriented perpendicular to the pump beam, we have demonstrated a heuristic method for measuring alkali-metal spin polarization. Transverse Probe Beam: Linearly-polarized light normal to the z quantization axis can have two polarizations (Fig. 1): - π light drives Δmf = 0 transitions - πy light drives equally Δmf= +1 and Δmf = -1 transitions Experimental Results: Absorption profiles of π and πyprobe beams were subtracted to give a difference signal, D. The most prominent feature, referred to as Dmin, corresponds to πy more strongly absorbed than π near the 87Rb Fg = 2 → Fe = 1 transition. Fig 4: Absorption profiles for transverse vertically and horizontally polarized light and the difference between those two signals for rubidium densities of 2.4·1012 cm-3, 10 torr N2 buffer gas. Fig. 1: A circularly-polarized beam pumps the Rb vapor. Transmission of perpendicular π and πy linearly-polarized probe beams is measured. Fig. 2: Sketch of possible transitions driven by transverse linearly-polarized light. Fig. 5: Dvs PRb for five rubidium densities and linear fit coefficients for each measurement. Dmin Fig. 5: Dmin versus longitudinal polarization measured by Faraday rotation [1]. Probe Absorption in Maximally Polarized Vapor: (all atoms in mf= +F) Fg> Fe (Fig. 3, left) - π probe will not be absorbed - πy probe will be absorbed Fg= Fe(Fig. 3, right) - π probe will be absorbed - πyprobe will be absorbed 50% Fg< Fe - no absorption difference Modeling: A model is being developed to describe Fig. 5. For the mF = +2 state in 87Rb Fg = 2 → Fe = 1 transition, π and πyprobe contributions are (2) , (3) where k21is the laser induced transition rate 87Rb Fg = 2 → Fe = 1 transition. Terms in brackets show absorption strength. Other rates include spontaneous decay and spin-relaxation [2]. Fig. 4: Absorption profiles for πyand πlight and their difference (πy- π ) for Rbdensity of 2.4·1012cm-3 and 10 TorrN2 buffer gas. The positions of hyperfine transitions are given at the bottom from left to right: 87Rb Fg= 2 → Fe = 1, 87Rb 2 → 2, 85Rb 3 → 2, 85Rb 3 → 3, 85Rb 2 → 2, 85Rb 2 → 3, 87Rb 1 → 1, 87Rb 1 → 2. Fig. 6: Dependence of linear fit coefficients in Eq. 1 versus N. Analysis: Data taken for seven Rb densities, N, each with 10 Torr of N2 buffer gas, indicate an approximately linear relationship between Dminand PRb (Fig. 5). The non-zero intercept of lower densities is due to residual optical pumping by the probe beam alone. Data was fit to the hyperbolic form . (1) Potential Application: This method could be used to map spatial polarization variations of alkali-metal vapors. It has an advantage over traditional Faraday rotation in that it is relatively simple to set up. Fig. 7: Comparison of measurements performed using the longitudinal Faraday rotation method and the transverse absorption method. References: [1] H. Batelaan, A.S. Green, B.A. Hitt, and T.J. Gay, Phys. Rev. Lett. 82, 4216 (1999). [2] E.B. Norrgard, D. Tupa, J.M. Dreiling, and T.J. Gay, Phys. Rev. A 82, 033408 (2010). This work was supported by NSF Grant PHY-0855629 and PHY-0821385 (MRI) and is unclassified: Los Alamos Unlimited Release LA-UR 12-02789. *Current address: Yale University, New Haven, CT 06520 If the N-dependence of the A and B fit-coefficients is found, the polarization of a Rb vapor of known density can be determined by simply measuring Dmin. Fig. 3: Possible transitions from Fg= 2, mf = 2 to Fe= 1 driven by transverse linearly-polarized light for left: 87Rb Fg = 2 → Fe = 1 and right: 87Rb Fg = 2 → Fe = 2 .