Download
1 / 9
90 likes | 214 Views
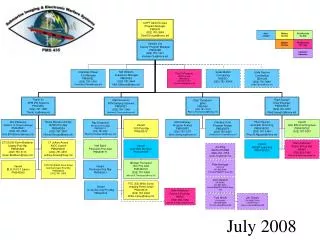
AOD Evaluation Advisory Group July 24, 2008. AGENDA Introductions SQI Reports Breakdown SQI Reports 2 nd Quarter Consumer Satisfaction Result Missing Data Report Update Other and Adjourn. SQI Indicator Page Last Columns. Compare 3-Year Average Score vs. Threshold. For example:

E N D
AOD Evaluation Advisory GroupJuly 24, 2008 AGENDA • Introductions • SQI Reports Breakdown • SQI Reports 2nd Quarter • Consumer Satisfaction Result • Missing Data Report Update • Other and Adjourn
SQI Indicator PageLast Columns Compare 3-Year Average Score vs. Threshold For example: 3-Year Average Score vs. Threshold: 12 vs. 11 12 is NOT <80% of 11----- N 12 is >= 80% of 11---- Y 12 is >= 90% of 11---- Y 12 is >= 100% of 11---- Y 12 is NOT >=110% of 11---- N
SQI Report Summary Page Explanation • Total Standard: the number of indicators recorded. In this example, 5 indicators were recorded. • Performance: the number of indicator for each key score. In this example, there is zero score 5, one score 4, one score 3, two score 2 and one score • Average Score: weighted average of all the scores. In the example, the average score is calculated as (5*0+4*1+3*1+2*2+1*1)/5=2.4
Consumer Satisfaction Survey 2008 Summary • 6516 phone numbers provided • 526 surveys completed (too many bad #’s) • 92% of the clients considered the services helped them to deal more effectively with their problems • Aggregate score (sum of all scores from 8 questions) is 27.75, met the desired target 27