Download
1 / 29
290 likes | 444 Views
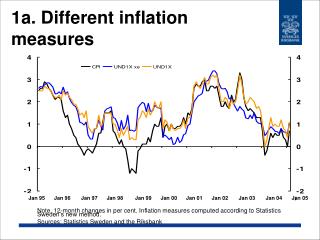
Alternative Inflation Measures. Comparison: core vs. overall. Overall measures: very volatile, especially because of food & energy shocks Core = excluding food & energy here; but research works on alternatives. Comparison across measures. Examine GDP price index, PCE price index, CPI.

E N D
Comparison: core vs. overall • Overall measures: very volatile, especially because of food & energy shocks • Core = excluding food & energy here; but research works on alternatives
Comparison across measures • Examine GDP price index, PCE price index, CPI
Differences between measures • Coverage (scope) • CPI: out of pocket spending of urban consumers • PCEPI: prices of all personal consumption expenditures in NIPA • GDPPI: price index of prices of all goods produced in economy (70% of which is in PCEPI)
Differences between measures • Weights: • PCEPI and GDPPI: weights updated every quarter; based on business surveys (production measures) • CPI: weights updated every two years; based on household surveys (out-of-pocket expenditure measures)
Differences between measures • Revisions: • PCEPI and GDPPI: revised as time passes to better reflect true weights across sample of businesses • CPI: never revised, except for seasonal adjustment
Differences between measures • Bias: • PCEPI and GDPPI: small bias because of quality adjustment bias; around 0.5% for PCEPI and 0.4% for GDPPI • CPI: larger bias because of quality adjustment bias and substitution bias; at least 1.0%
Differences between measures • Examples • Housing prices are 15% of PCEPI, but 32% of CPI (urban) • Medical prices are 20.5% of PCEPI, but only 6.2% of CPI (out of pocket)
Data revisions • GDPPI and PCEPI are revised; CPI is not • That means the CPI is worse, not better
Data revisions • Policy implications: the Fed could be confused by initial data, as it was in 2003
Data revisions • In 2000, Fed switched main variable for inflation to PCE price index (PCE inflation); in 2004 switched to PCE price index excluding food and energy prices (core PCE inflation); in 2007 it began using both • Problem: these variables get revised • Issue: are the revisions large enough to worry about?
Data Revisions • May 2002: data show decline in core PCE inflation from 2.0% in 2000Q3 to 1.2% in 2002Q1 • Academic research on deflation and the zero bound are fresh in policymakers’ minds
Core PCE inflation rate from 1997Q1 to 2002Q1, as observed May 2002
Data revisions • Perhaps as a consequence of worry about low inflation, Fed drives real fed funds rate to negative levels for first time since early 1970s • Fed adds phrase to FOMC statement that it worries about an “unwelcome fall in inflation” • But: revised data by December 2003 show that inflation wasn’t declining after all v=May2002 v=Dec2003 2000Q3 2.0% 1.7% 2002Q1 1.2% 1.5%
Data revisions • The Fed gets rid of the “unwelcome fall” language by May 2004. Revised data by August 2005 show Fed should have worried about an unwelcome rise in inflation 2000Q3 2002Q1 v=May 2002 2.0% 1.2% v=Dec2003 1.7% 1.5% v=Aug2005 1.6% 1.8%
Data revisions • Policymakers need to understand revisions to inflation
Chained CPI • The chained CPI uses chain weighting to improve on the overall CPI • It works, but to do so, it must be revised • Data are final after two years • Revisions cause problems for changing payments, as in Social Security
Conclusions • There is no perfect measure of inflation • Fed uses multiple measures • Using core inflation prevents overreaction to short-term shocks • Fed should be aware of revisions • The chained CPI is more accurate than the overall CPI