Download
1 / 18
180 likes | 252 Views
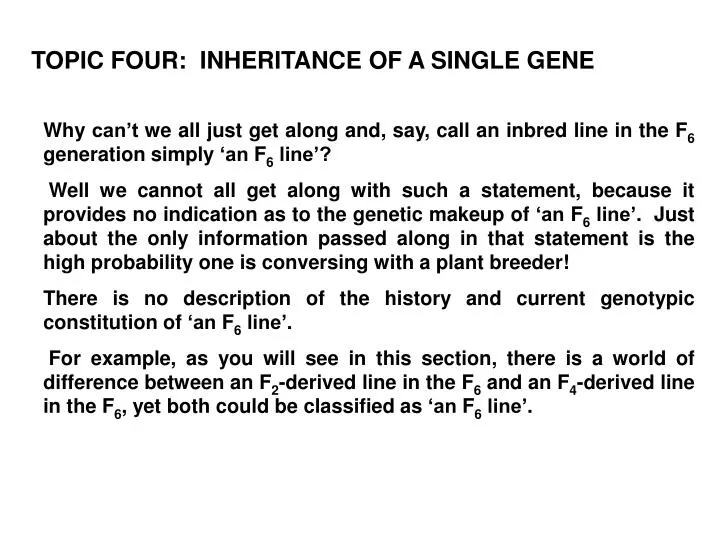
TOPIC FOUR: INHERITANCE OF A SINGLE GENE. Why can’t we all just get along and, say, call an inbred line in the F 6 generation simply ‘an F 6 line’?

E N D
TOPIC FOUR: INHERITANCE OF A SINGLE GENE Why can’t we all just get along and, say, call an inbred line in the F6generation simply ‘an F6 line’? Well we cannot all get along with such a statement, because it provides no indication as to the genetic makeup of ‘an F6 line’. Just about the only information passed along in that statement is the high probability one is conversing with a plant breeder! There is no description of the history and current genotypic constitution of ‘an F6 line’. For example, as you will see in this section, there is a world of difference between an F2-derived line in the F6 and an F4-derived line in the F6, yet both could be classified as ‘an F6 line’.
The frequency of heterozygotes decreases by one-half with each generation of selfing in the absence of selection or mutation The frequency of heterozygotes is estimated by (1/2)G, where G is the number of generations of selfing, i.e., F2 = (1/2)1 = 1/2; F3 = (1/2)2 = 1/4; F4 = (1/2)3 = 1/8.
Awareness of the genotypes and frequencies of progenies resulting from self-pollination is the key to understanding the dynamics of a breeding nursery in the critical F2 to F8 generations that occupy the majority of a plant breeder’s efforts. It is also essential for a full understanding of recombinant inbred techniques in the development of mapping populations It is of utmost importance to grasp the content of the following three examples because the theme will arise continuously throughout the remainder of the course.
1-250 251-750 751-1000 1000 F2:3 lines planted in 1000 rows Like an F2 Segregation at ‘A’ locus ? Like an F3 Like an F4 Like an F5 Fully Inbred Only aa Mix AA aa Only AA
1) The frequencies of homogeneous and segregating derived lines in the F2:Y generation is the exact same as the frequency of homozygous and heterozygous plants, respectively, in the F2 generation (Tier 1 number). 2) The frequencies of genotypes (AA : aA : aa) within the segregating derived lines in the F2:Y generation depends on the number of generations of self-pollination undergone since the single heterozygote plant was selected in the F2 generation (i.e., Tier 2 number minus Tier 1 number).
1-438 439-563 564-1000 Like an F2 1000 rows Like an F3
I warned previously about the dire lack of information contained in the simple designation of ‘an F6 line’. This terminology provides no description of the history or current genotypic constitution of ‘an F6 line’. In both Examples 3 and 4 we have developed what could be described as two sets of ‘F6 lines’. But the two sets of lines, F2:6 and F4:6, are radically different in their development and genotypic content. A much greater percentage of random F4:6 lines are homogeneous (876 versus 500) and the within segregating line variation is much different (0.06 versus 0.25 heterozygous plants).
Two sets of lines with the same designation (F4:6) do not necessarily have the same genotypic frequencies between lines Like selecting 1000 random Plants from an F3 bulk population Like an F2 Like an F3
Segregation at Multiple Loci with Self-Pollination 1. Unlinked Loci. In the vast majority of cases involving cultivar development, the F2 or S0 populations will be segregating at more than one locus. The overall effect of multilocus segregation on genotype frequencies is to reduce the proportion of completely homozygous individuals relative to the case with only single locus segregation. AA BB bb AA aa BB bb aa In the two-locus example in Table 4.2, the probability of homozygosity at the A or B locus is 0.5. The probability of homozygosity at both loci is 0.5 x 0.5 = 0.25. In the F3 population the equivalent probability is 0.75 x 0.75 = 0.56, and in the F4 population 0.876 x 0.876 = 0.77 (Appendix 4B).
Many plant breeders prefer to wait until the F5 generation or later before making selections in their nurseries. Two reasons are highlighted by this example: (1) the proportion of homozygous individuals in the population is higher in later generations and (2) if one observes a superior genotype in later generations, its performance in subsequent generations is more predictable based on the low probability that its loci governing the trait are in the heterozygous state. Purification of lines prior to Cultivar Release Frequently, the first generation of expensive yield testing will involve , say, F5:7 lines. Obviously there will be considerable residual heterozygosity / heterogeneity in this material. Lines that perform well in the first year of yield evaluation will start to undergo purification for release based on selecting single plants in the next season. Under this scenario, the cultivar would be an F8-derived line. And it is common to see them being F9-, F10 - and later generation derived lines
Number of Potential Genotypes in a Population Although completely inbred individuals are an aid to efficient selection, unfortunately, one is easily swamped with genetic variability among the same completely inbred individuals If the parents in a cross have contrasting alleles at n loci, then 2n different inbred genotypes can be derived from the cross. In the case above where the parents differed at 20 loci, then 220 different inbred individuals can potentially be derived--i.e., 1,048,576. The advantage of working with an inbred population can be illustrated when one considers that 320 different genotypes are possible in the F2 generation--i.e., 3,486,784,401!
Our bulk population plot size is about 1/220th of an acre planted with 2500 seeds. Obviously we do not try to grow bulk populations that contain all potential genotypes resulting from a cross. Our strategy is to sample a large number of different segregating populations containing a limited array of all potential genotypes rather than put significant resources into a few populations with a larger array of genotypes. WHY? The combining ability of parents can be unpredictable when breeding for 19 essential traits as we do in wheat. The unpredictable but inevitable virulence pattern changes in fungal and insect pathogens makes identification of ‘the best’ cross difficult
Recovery of Progeny Superior to the Best Parent Of great value to the breeder, however, is the recovery of genotypes containing the superior allele in the homozygous state at more loci than are contained by the best parent in the cross. For example, assume the trait in question is governed by 20 loci. Inbred Parent 1 contains the superior allele at loci numbers 1 to 11, Inbred Parent 2 contains the superior allele at loci numbers 12 to 20. Success to the breeder is the recovery of genotypes with the superior allele in the homozygous state at 11, 12, 13, 14, 15, ... 20 loci.
The probability of such success can be estimated using the Binomial Probability Formula: P(x = k) = (nk)pk(1 - p)n-k where n = number of loci controlling the trait (‘independent trials’), k = number of loci homozygous for the superior allele (‘successes’), p= probability of fixing the superior allele in the homozygous state in the selfing generation Fi (i.e., 0.25 in F2; 0.375 in F3; 0.438 in F4), (nk) = , the binomial coefficient which estimates the number of ways in which k successes can be chosen from among n trials
Number of Potential Genotypes in a Population These probabilities likely illustrate one mechanism for the small, but steady increase in genetic potential for quantitatively controlled traits brought about by a century of scientific cultivar development. Each cycle of cultivar development of approximately 10 to 15 years has resulted in a steady accumulation of superior genotypes at the loci controlling the traits.
Linked Loci. Linkage reduces the level of independence between loci, it decreases the number of independent chromosomal units (or loci). Linkage is a conservative influence which tends to maintain existing parental arrangements. Thus, linkage increases the frequency of completely homozygous individuals in a segregating population relative to that expected if the loci were independent