Download
1 / 30
300 likes | 390 Views
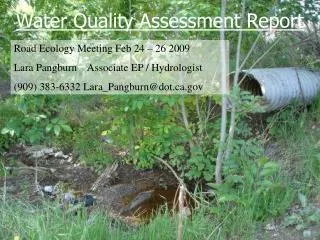
2013 Water Quality Assessment Update. Ed Sherwood Tampa Bay Estuary Program 263 13 th Ave. South St. Petersburg, FL 33701. Annual Decision Support Process. Increase Water Clarity. Reduce Nitrogen Loads. Reduce Chloro- phyll. Increase Sea- grass Cover.

E N D
2013 Water Quality Assessment Update Ed Sherwood Tampa Bay Estuary Program 263 13th Ave. South St. Petersburg, FL 33701
Annual Decision Support Process Increase Water Clarity Reduce Nitrogen Loads Reduce Chloro- phyll Increase Sea- grass Cover • Annual report card for Tampa Bay • Specific to each of the 4 major bay segments • Provides for adaptive management of a sentinel estuarine indicator (seagrass)
FDEP Recognized Site Specific Thresholds for Chlorophyll-a to Maintain Tampa Bay Reasonable Assurance • Hillsborough Bay: 15.0 ug/L • Old Tampa Bay: 9.3 ug/L • Middle Tampa Bay: 8.5 ug/L • Lower Tampa Bay: 5.1 ug/L If any one bay segment exceeds these values in 2 straight years, then additional compliance assessment steps are required by the TBNMC and TBEP.
Summary of Results • Water quality in Tampa Bay continues to be within management targets & regulatory thresholds; chlorophyll-a and water clarity conditions are supporting seagrass expansion in the 4 main bay segments. • Seagrass acreage in Tampa Bay continues to increase, next update anticipated in early 2015. • Work continues on developing the integrated model for OTB; 2012 RA Update Accepted by FDEP in April 2013
Science-Based Assessment • Rely on long-term ambient water quality stations sampled by EPCHC • 45 fixed stations have been monitored since 1974 • Annual averages developed from chlorophyll-a & secchi disk depth measurements
Management Framework • Bay segment annual average values compared to established bay segment targets for chlorophyll-a and water clarity • Results of each comparison placed into decision matrix framework • Overall management response determined for each bay segment
2013 Results *Less than a small magnitude exceedence
Tampa Bay Chl-a (2007-2012) • Significant Pyrodinium blooms occurred in the summer of 2008, 2009 and 2010
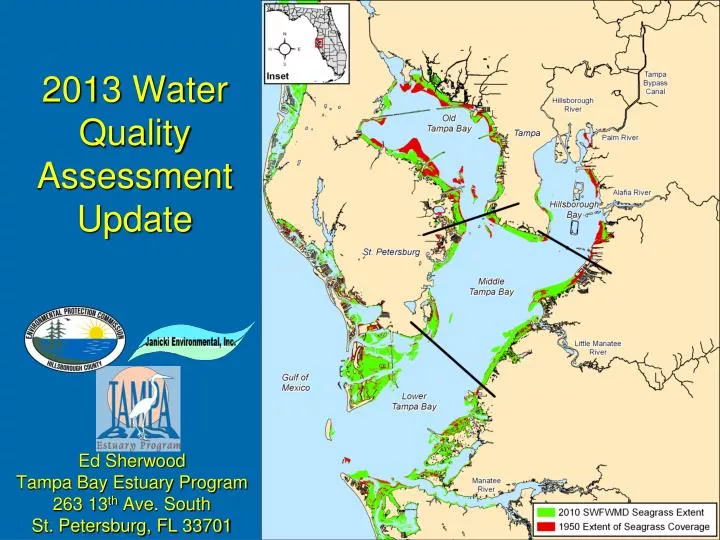
2010 Seagrass Estimates • All TB segments showed increased acreage • Upper bay segments still have room to “grow”
TBEP Nitrogen Management Strategy Reduce Nitrogen Loads Reduce Chloro- phyll Sea- grass Recover Reduce Light Atten- uation
Reduce Nitrogen Loads Reducing Nitrogen Loads • Tampa Bay Nitrogen Management Consortium formed in 1996 • Collectively accepted responsibility to reduce TN loads to Tampa Bay • TN loads are capped at levels appropriate to maintain bay water quality for seagrass expansion
TBEP Nitrogen Management Strategy Reduce Nitrogen Loads Reduce Chloro- phyll Sea- grass Recover Reduce Light Atten- uation 1998: NMC Partnership Formed to “Hold the Line” 1996-2009: NMC Projects Preclude >430t N / yr 2010: RA Accepted & Adopted by FDEP, N Load Allocations Voluntarily & Proactively Developed 2011+ : Demonstrating RA Compliance & Providing Input on Criteria Development 2012: RA Update Completed! 2006: First-time All Segments Meet TBEP Management Targets
Management Framework • Bay segment annual average values compared to established bay segment targets for chlorophyll-a and light attenuation • Results of each comparison placed into decision matrix framework • Overall management response determined for each bay segment
Observed Seagrass Gains & Losses 2001-2004 2004-2006
Observed Seagrass Gains & Losses 2006-2008 2008-2010