Download
1 / 1
10 likes | 105 Views
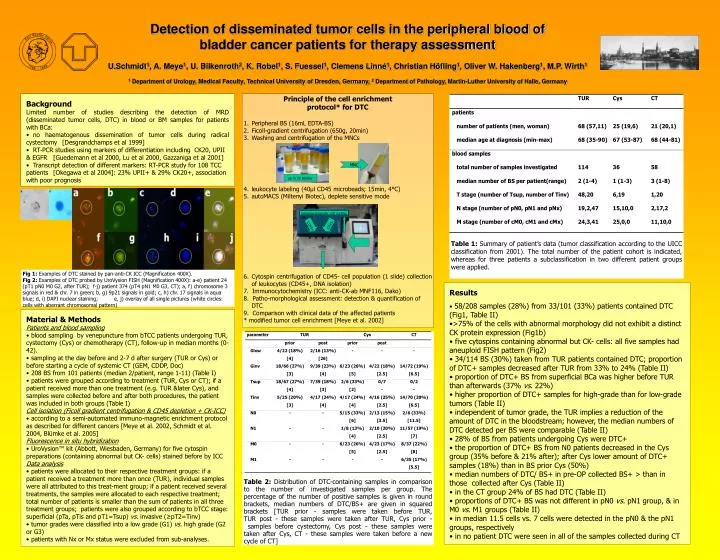
Principle of the cell enrichment protocol* for DTC Peripheral BS (16mL EDTA-BS) Ficoll-gradient centrifugation (650g, 20min) Washing and centrifugation of the MNCs leukocyte labeling (40µl CD45 microbeads; 15min, 4°C) autoMACS (Miltenyi Biotec), deplete sensitive mode

E N D
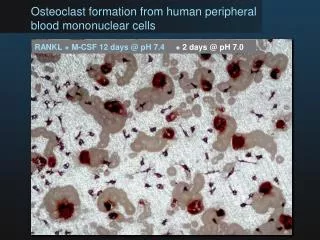
Principle of the cell enrichment • protocol* for DTC • Peripheral BS (16mL EDTA-BS) • Ficoll-gradient centrifugation (650g, 20min) • Washing and centrifugation of the MNCs • leukocyte labeling (40µl CD45 microbeads; 15min, 4°C) • autoMACS (Miltenyi Biotec), deplete sensitive mode • Cytospin centrifugation of CD45- cell population (1 slide) collection of leukocytes (CD45+, DNA isolation) • 7. Immunocytochemistry (ICC: anti-CK-ab MNF116, Dako) • 8. Patho-morphological assessment: detection & quantification of DTC • 9. Comparison with clinical data of the affected patients • * modified tumor cell enrichment [Meye et al. 2002] Table 1: Summary of patient’s data (tumor classification according to the UICC classification from 2001). The total number of the patient cohort is indicated, whereas for three patients a subclassification in two different patient groups were applied. Table 2: Distribution of DTC-containing samples in comparison to the number of investigated samples per group. The percentage of the number of positive samples is given in round brackets, median numbers of DTC/BS+ are given in squared brackets [TUR prior - samples were taken before TUR, TUR post - these samples were taken after TUR, Cys prior - samples before cystectomy, Cys post - these samples were taken after Cys, CT - these samples were taken before a new cycle of CT] MNC up to 20 BS/day immuno-magnetic cell sorting (MACS) CD45- CD45+ Detection of disseminated tumor cells in the peripheral blood of bladder cancer patients for therapy assessment U.Schmidt1, A. Meye1, U. Bilkenroth2, K. Robel1, S. Fuessel1, Clemens Linné1, Christian Höfling1, Oliver W. Hakenberg1, M.P. Wirth1 1 Department of Urology, Medical Faculty, Technical University of Dresden, Germany,2 Department of Pathology, Martin-Luther University of Halle, Germany • Background • Limited number of studies describing the detection of MRD (disseminated tumor cells, DTC) in blood or BM samples for patients with BCa: • no haematogenous dissemination of tumor cells during radical cystectomy [Desgrandchamps et al 1999] • RT-PCR studies using markers of differentiation including CK20, UPII & EGFR [Guedemann et al 2000, Lu et al 2000, Gazzaniga et al 2001] • Transcript detection of different markers: RT-PCR study for 108 TCC patients [Okegawa et al 2004]: 23% UPII+ & 29% CK20+, association with poor prognosis Fig 1: Examples of DTC stained by pan-anti-CK ICC (Magnification 400X). Fig 2: Examples of DTC probed by UroVysion FISH (Magnification 400X): a-e) patient 24 (pT1 pN0 M0 G2, after TUR); f-j) patient 374 (pT4 pN1 M0 G3, CT); a, f) chromosome 3 signals in red & chr. 7 in green; b, g) 9p21 signals in gold; c, h) chr. 17 signals in aqua blue; d, i) DAPI nuclear staining; e, j) overlay of all single pictures (white circles: cells with aberrant chromosomal pattern) • Results • 58/208 samples (28%) from 33/101 (33%) patients contained DTC (Fig1, Table II) • >75% of the cells with abnormal morphology did not exhibit a distinct CK protein expression (Fig1b) • five cytospins containing abnormal but CK- cells: all five samples had aneuploid FISH pattern (Fig2) • 34/114 BS (30%) taken from TUR patients contained DTC; proportion of DTC+ samples decreased after TUR from 33% to 24% (Table II) • proportion of DTC+ BS from superficial BCa was higher before TUR than afterwards (37% vs. 22%) • higher proportion of DTC+ samples for high-grade than for low-grade tumors (Table II) • independent of tumor grade, the TUR implies a reduction of the amount of DTC in the bloodstream; however, the median numbers of DTC detected per BS were comparable (Table II) • 28% of BS from patients undergoing Cys were DTC+ • the proportion of DTC+ BS from N0 patients decreased in the Cys group (35% before & 21% after); after Cys lower amount of DTC+ samples (18%) than in BS prior Cys (50%) • median numbers of DTC/ BS+ in pre-OP collected BS+ > than in those collected after Cys (Table II) • in the CT group 24% of BS had DTC (Table II) • proportions of DTC+ BS was not different in pN0 vs. pN1 group, & in M0 vs. M1 groups (Table II) • in median 11.5 cells vs. 7 cells were detected in the pN0 & the pN1 groups, respectively • in no patient DTC were seen in all of the samples collected during CT • Material & Methods • Patients and blood sampling • blood sampling by venepuncture from bTCC patients undergoing TUR, cystectomy (Cys) or chemotherapy (CT), follow-up in median months (0-42). • sampling at the day before and 2-7 d after surgery (TUR or Cys) or before starting a cycle of systemic CT (GEM, CDDP, Doc) • 208 BS from 101 patients (median 2/patient, range 1-11) (Table I) • patients were grouped according to treatment (TUR, Cys or CT); if a patient received more than one treatment (e.g. TUR &later Cys), and samples were collected before and after both procedures, the patient was included in both groups (Table I) • Cell isolation (Ficoll gradient centrifugation & CD45 depletion + CK-ICC) • according to a semi-automated immuno-magnetic enrichment protocol as described for different cancers [Meye et al. 2002, Schmidt et al. 2004, Blümke et al. 2005] • Fluorescence in situ hybridization • UroVysion™ kit (Abbott, Wiesbaden, Germany) for five cytospin preparations (containing abnormal but CK- cells) stained before by ICC • Data analysis • patients were allocated to their respective treatment groups: if a patient received a treatment more than once (TUR), individual samples were all attributed to this treat-ment group; if a patient received several treatments, the samples were allocated to each respective treatment; total number of patients is smaller than the sum of patients in all three treatment groups; patients were also grouped according to bTCC stage: superficial (pTa, pTis and pT1=Tsup) vs. invasive (≥pT2=Tinv) • tumor grades were classified into a low grade (G1) vs. high grade (G2 or G3) • patients with Nx or Mx status were excluded from sub-analyses.