Download
1 / 18
180 likes | 358 Views
Chapter 12 Long-Term Climate Regulation. Sun about 30% less luminous than today - Ts would have been below freezing - Earth seems to have had liquid water nonetheless - Faint Young Sun Paradox (FYSP) Warm Ts maintained by effect of greenhouse gases - how?

E N D
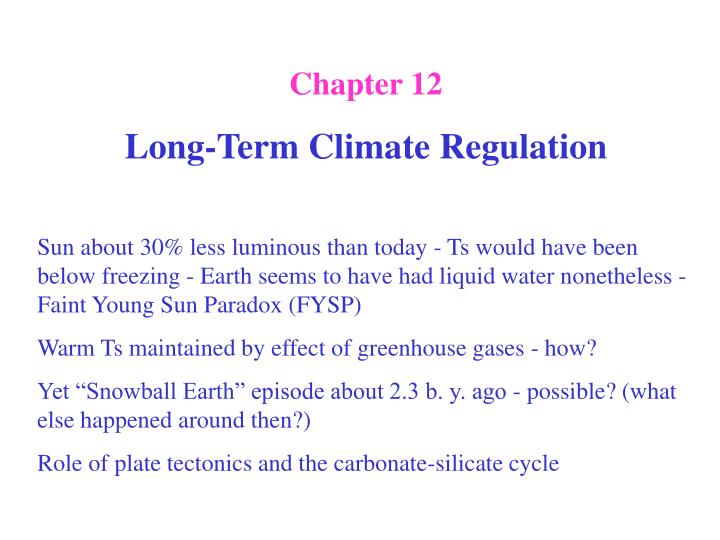
Chapter 12 Long-Term Climate Regulation Sun about 30% less luminous than today - Ts would have been below freezing - Earth seems to have had liquid water nonetheless - Faint Young Sun Paradox (FYSP) Warm Ts maintained by effect of greenhouse gases - how? Yet “Snowball Earth” episode about 2.3 b. y. ago - possible? (what else happened around then?) Role of plate tectonics and the carbonate-silicate cycle
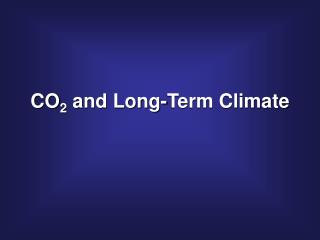
FYSP - figure shows temperature variation (left vertical axis) and relative solar luminosity (right vertical axis) with time (horizontal axis)
FYSP - Explanation of figure 12.2 The solid curve shows the change in solar luminosity(S) relative to today’s value (S0) since the “beginning”, about 4.8 b. y. ago. Dotted lines are for temperature: Ts = mean surface T, Te = effective radiating T and, for reference, the horizontal dotted line corresponds to the freezing T of water. Ts is calculated with a model that assumes water vapor feedback, a constant albedo and level of atmospheric CO2 (340ppm) and the solar luminosity increasing by 30% over time. Ts is calculated using the principle of planetary energy balance (see Chapter 3 and lab/HW work) The shaded region between each dotted line represents the greenhouse effect on temperature. Increase of greenhouse effect with time and solar luminosity is due to the water vapor feedback.
FYSP - Comments on figure 12.2 • If we simply consider the luminosity of the sun- it appears that the planet would be frozen until about 1,900,000 years ago. However, evidence from the geologic record proves that this was not the case. There was liquid water at 3.8 bya and life was certainly present by approx 2.2 bya. • The diagram shows us in a visual manner that there must have been other factors influencing the Ts throughout Earth’s history or the planet would have been frozen. Other factors: • geothermal flux? OK but not large enough, • lower albedo? possible but it needed to be near zero, • greenhouse effect much stronger in the past? OK. Which gases and how? • CO2-rich Early Atmosphere? (recall Ca-Si cycle is a sink of CO2) possible if smaller continents or more volcanism.
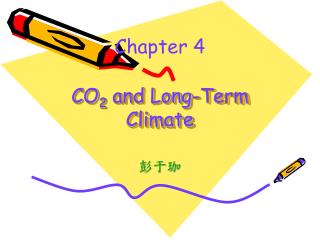
CO2-rich Early Atmosphere? Figure 12-3 shows the time (horizontal axis) variation of atmospheric concentrations of CO2 (on both vertical axes, two different measures of the same variable!) needed to compensate for changing (reduced) solar luminosity.
Figure 12-3 - Notes & Comments • The figure shows the CO2-partial pressure in bars on the left y-axis, relative (to today’s, hence NO UNITS!) CO2 concentration and time on the x-axis. • The shaded area indicate the range between upper and lower bound on CO2 concentrations needed to keep the Earth’s Ts above freezing as solar luminosity was reduced. • The vertical dark-solid lines at times of glaciations specified in the figure show limits of the CO2 concentrations (needed) estimated from model simulations of past climates. These estimates are consistent with geological evidence. • This figure implies that a CO2 level required to keep the ocean-covered Earth would raise the temperature to 80-90 C! And this has implications for the origins of life - recall the presence of heat loving- hyperthemophiles.
Figure 12-3 - Notes & Comments Question: according to these model estimates, what was the range of atmospheric CO2concentrations that were needed to keep Earth (and particularly early oceans!) from freezing at 4.5, 3.5, 2.5 and 1.5 b.y. ago, respectively? Give your answers in terms of partial pressure values AND in relative (to today’s) values of CO2 concentrations. For example, for ‘time before present’ (x-axis) = 4.5 b.y. we look at values on both y-axis to answer this question. In the left y-axis, we read that at that time, pCO2 ranged between 0.1 and 10 bars, and of course it could have been any of the values in between according to the shaded part. Then we look at the right y-axis to determine the corresponding values of CO2 concentration relative to today’s value, and we read that these range between 500 and 15000 x present level of CO2 concentration! Knowing present atmospheric levels (in ppm, for example), this answer could also be given in terms of the range of ‘ppm’ values that would have been needed. You should make sure you can follow this example ande answer the question for the other times! and in ‘ppm’ values.
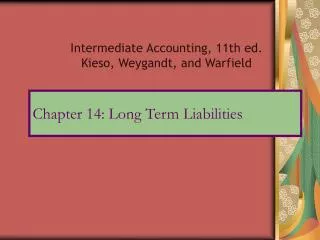
1000 ppm upper limit on Late Archean CO2 conc. derived from paleosols Freezing point of water Figure 12-4: dependence of average Ts (the dependent variable on the y-axis) on partial pressure of atmospheric CO2 (the independent variable on the x-axis) for different values of the fractional abundance (mixing ratio) of atmospheric CH4, for S/So = 0.8 (from model simulations!)
Figure 12-4 - Notes & Comments The solid curve displays the changes of average global surface temperature as a function of atmospheric CO2 and CH4 concentrations. These calculations were performed for an assumed solar luminosity of 80% of the present value, which according to figure 12-2 was the estimated value 2.8 billion years ago. The figure is about the role of Methane in keeping Ts warm enough. Originally, methane could have been produced at sites of seafloor spreading (this is:prior to the origination of methanogens). Once methanogenic bacteria arise the rate of CH4 would have been increased. Methane is a strong greenhouse gas, hence the figure shows the possibility that methane had a large effect on the Archean atmosphere.
Figure 12-4 - Notes & Comments ‘Reading’ the figure: for a CH4 mixing ratio of 10-4 (or 1/10000!) what pCO2 value is necessary to keep Ts above freezing? and for a CH4 mixing ratio of approximate 3 x 10⁻³? Proceed as in the example for Figure 12-3: read values on the axis, keep in mind the freezing point of water (temperature of), make sure you give answers with numbers AND units, be able to relate measures of present values of atmospheric CO2 concentrations; namely: what’s today’s value of pCO2 and what value it corresponds to in ppm?
Long-term climate record: five periods of glaciations - 2.5 b. y. ago - the rise of oxygen would have used up much of the methane sending the Earth into freezing - evidence supports this then climate gets warm again (a) carbonate-silicate weathering cycle might explain this (b) methane in the atmosphere recovered climate gets cold again - around 0.8 b. y. ago - Snowball Earth 4. climate also varied over the past 0.5 b.y. (500 m. y) - 3 major glacial periods occurred: one about 440 m.y. ago (brief), one about 280 m.y. ago (longish) and the most recent Pleistocene glaciation (see Fig. 12.11). This last period will be discussed more in Chapter 14.
1. Paleozoic - 544 to 250 m.y. period: mostly warm, ice-free except for two periods, most important the Permian-Carboniferous - this cooling most likely due to decrease in atmospheric CO2 concentration. 2. Mesozoic - age of the dinosaurs, warm and dry and much smaller equator-to-pole temperature difference - 251 to 65 m.y. ago. Reasons: CO2 concentrations with ice-albedo feedback, backward thermohaline circulation, larger extent of Hadley cell. 3. Cenozoic - past 65 m. y. of Earth history, cooling begins about 70 - 80 m. y. ago, cold over the past 2 m. y approximately (Quaternary). Reasons: carbonate-silicate weathering disturbed by plate tectonic causes - see Fig. 12.16.
Latitudinal temperature gradient during the Mesozoic (specifically during the mid-Cretaceous, 80 m. y. ago approx.) compared to today’s values. Equator was between 2-6 deg C warmer than today and the poles 20 to 30 deg C warmer!
more 13C - lower CO2 Less 13C in sediments from the Mesozoic than in younger sediments higher levels of CO2 then than now. Inferring past CO2 concentrations based on carbon isotopes. Photosynthetic organisms take up 12C faster than 13C, more so if CO2 is abundant. So, low 13C/12C, negative 13, corresponds to organic matter produced under high-CO2 conditions. If CO2 concentration is low, then organisms use whatever is available and the ratio is relatively unchanged. Data consistent with decrease in CO2 over the past 100 m. y.
Collision between India and Asia around 40 m. y. ago gave rise to Himalayas, providing large areas for weathering to proceed efficiently and rapidly, aided by rainfall (monsoons) - silicate weathering could have decreased levels of CO2 toward present values