Download
1 / 21
210 likes | 321 Views
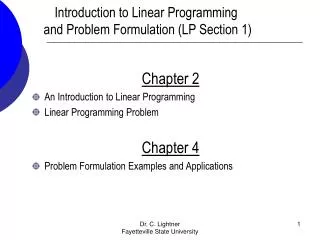
3.4 – Linear Programming. 3.4 – Linear Programming. Ex. 1 Graph the system of inequalities. Name the coordinates of the vertices of the feasible region. Find the max & min values of the given function for this region. y > -4 x < 3 y < 3 x – 4 f ( x , y ) = x – y.

E N D
3.4 – Linear Programming Ex. 1 Graph the system of inequalities. Name the coordinates of the vertices of the feasible region. Find the max & min values of the given function for this region. y> -4 x< 3 y< 3x – 4 f(x,y) = x – y
3.4 – Linear Programming Ex. 1 Graph the system of inequalities. Name the coordinates of the vertices of the feasible region. Find the max & min values of the given function for this region. y> -4 x< 3 y< 3x – 4 f(x,y) = x – y
3.4 – Linear Programming Ex. 1 Graph the system of inequalities. Name the coordinates of the vertices of the feasible region. Find the max & min values of the given function for this region. y> -4 x< 3 y< 3x – 4 f(x,y) = x – y
3.4 – Linear Programming Ex. 1 Graph the system of inequalities. Name the coordinates of the vertices of the feasible region. Find the max & min values of the given function for this region. y> -4 x< 3 y< 3x – 4 f(x,y) = x – y
3.4 – Linear Programming Ex. 1 Graph the system of inequalities. Name the coordinates of the vertices of the feasible region. Find the max & min values of the given function for this region. y> -4 x< 3 y< 3x – 4 f(x,y) = x – y
3.4 – Linear Programming Ex. 1 Graph the system of inequalities. Name the coordinates of the vertices of the feasible region. Find the max & min values of the given function for this region. y> -4 x< 3 y< 3x – 4 f(x,y) = x – y
3.4 – Linear Programming Ex. 1 Graph the system of inequalities. Name the coordinates of the vertices of the feasible region. Find the max & min values of the given function for this region. y> -4 x< 3 y< 3x – 4 f(x,y) = x – y
3.4 – Linear Programming Ex. 1 Graph the system of inequalities. Name the coordinates of the vertices of the feasible region. Find the max & min values of the given function for this region. y> -4 x< 3 y< 3x – 4 f(x,y) = x – y
3.4 – Linear Programming Ex. 1 Graph the system of inequalities. Name the coordinates of the vertices of the feasible region. Find the max & min values of the given function for this region. y> -4 x< 3 y< 3x – 4 f(x,y) = x – y
3.4 – Linear Programming Ex. 1 Graph the system of inequalities. Name the coordinates of the vertices of the feasible region. Find the max & min values of the given function for this region. y> -4 x< 3 y< 3x – 4 f(x,y) = x – y
3.4 – Linear Programming Ex. 1 Graph the system of inequalities. Name the coordinates of the vertices of the feasible region. Find the max & min values of the given function for this region. y> -4 x< 3 y< 3x – 4 f(x,y) = x – y
3.4 – Linear Programming Ex. 1 Graph the system of inequalities. Name the coordinates of the vertices of the feasible region. Find the max & min values of the given function for this region. y> -4 x< 3 y< 3x – 4 f(x,y) = x – y
3.4 – Linear Programming Ex. 1 Graph the system of inequalities. Name the coordinates of the vertices of the feasible region. Find the max & min values of the given function for this region. y> -4 x< 3 y< 3x – 4 f(x,y) = x – y
3.4 – Linear Programming Ex. 1 Graph the system of inequalities. Name the coordinates of the vertices of the feasible region. Find the max & min values of the given function for this region. y> -4 x< 3 y< 3x – 4 f(x,y) = x – y
3.4 – Linear Programming Ex. 1 Graph the system of inequalities. Name the coordinates of the vertices of the feasible region. Find the max & min values of the given function for this region. y> -4 x< 3 y< 3x – 4 f(x,y) = x – y
3.4 – Linear Programming Ex. 1 Graph the system of inequalities. Name the coordinates of the vertices of the feasible region. Find the max & min values of the given function for this region. y> -4 x< 3 y< 3x – 4 f(x,y) = x – y
3.4 – Linear Programming Ex. 1 Graph the system of inequalities. Name the coordinates of the vertices of the feasible region. Find the max & min values of the given function for this region. y> -4 x< 3 y< 3x – 4 f(x,y) = x – y
3.4 – Linear Programming Ex. 1 Graph the system of inequalities. Name the coordinates of the vertices of the feasible region. Find the max & min values of the given function for this region. y> -4 x< 3 y< 3x – 4 f(x,y) = x – y Max of 7 @ (3,-4)
3.4 – Linear Programming Ex. 1 Graph the system of inequalities. Name the coordinates of the vertices of the feasible region. Find the max & min values of the given function for this region. y> -4 x< 3 y< 3x – 4 f(x,y) = x – y Max of 7 @ (3,-4)
3.4 – Linear Programming Ex. 1 Graph the system of inequalities. Name the coordinates of the vertices of the feasible region. Find the max & min values of the given function for this region. y> -4 x< 3 y< 3x – 4 f(x,y) = x – y Max of 7 @ (3,-4) Min of -2 @ (3,5)