Download
1 / 27
270 likes | 374 Views
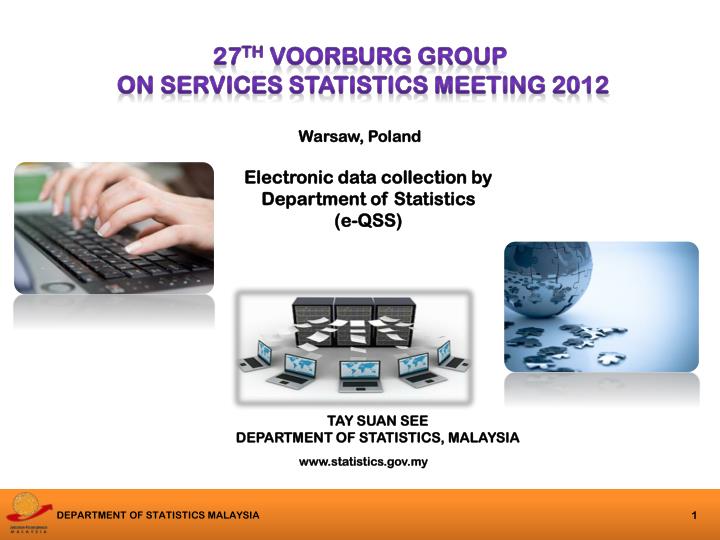
27 th voorburg group on services statistics meeting 2012. Warsaw, Poland. Electronic data collection by Department of Statistics (e-QSS). TAY SUAN SEE DEPARTMENT OF STATISTICS, MALAYSIA. www.statistics.gov.my. Presentation outline. About Malaysia. Overview.

E N D
27th voorburg group on services statistics meeting 2012 Warsaw, Poland Electronic data collection by Department of Statistics (e-QSS) TAY SUAN SEE DEPARTMENT OF STATISTICS, MALAYSIA www.statistics.gov.my
Overview • The Department of Statistics, (DOSM) Malaysia was established in 1949 under the Statistics Ordinance 1949. • Statistics Act 1965 (Revised 1989) • National statistical agency to collect, interpret and disseminate latest and real time statistics in the monitoring of national economic performance and social development. • Centralised data collection but other agencies and Ministries collect data for their own needs
Overview...cont’d • Set-up consists of 16 Divisions, 14 State offices with 28 operational centres • Staff strength of 3,300 employees • Needs of users for statistics routed through Main User Committee chaired by Economic Planning Unit
Activities of DOSM DOSM generate official statistics through surveys/censuses and compilations of secondary data
Approaches in Data Collection Demands for timely data
E-Survey • Development of Internet technologies has made e-Survey as another channel of information gathering increasingly important for government departments • In line with the Government initiatives to implement the Electronic Government online services, the Department of Statistics Malaysia developed e-Surveys since 2008 • e-Survey isonline survey submission of data on short-term surveys (monthly/quarterly) • This system is implemented to save time and costs in the process of gathering and disseminating data
Contribution of Services Sector … 10th Malaysia Plan (2015) : Services sector : 61.1%
Quarterly data collection of the services sub-sector is needed to….
Concepts and definitions used are based on.. Recommendations of the United Nations’ Statistical Office and Malaysia Standard Industrial Classification 2008 which adheres to International Standard Industrial Classification (ISIC) Rev. 4 classification of the industry of the establishment is based on the principal activity
INDEX OF SERVICES AS A SHORT TERM INDICATOR ON THE MOVEMENT IN THE SERVICES SECTOR RELEASE DATE SOURCE OF DATA • 2012 • Motor Vehicles • Wholesale Trade • Retail Trade IoDT IoS (Phase III) IoS (Phase I) Composite IoS IoS (Phase II) • Monthly Survey of DT • 2012 • Accommodation • Food & Beverage • Transport • Information & Communication • 2013 • Education • Health • Quarterly Survey of Services (commenced Q2 2009) • 2014 • Finance and Insurance • Professional • Real Estate • Art, Entertainment and Recreation 2014
Sample selection is based on .... Variable of selection: REVENUE Total sample: 9,396 establishments
Questionnaire contents Data available 6 weeks after reference quarter
Online survey submission.. ICT sub-sector has been selected to be the pioneer in implementing electronic data collection (e-QSS) Total sample : 507 establishments Pilot test was done in Q2 2012 (July 2012) Respondents (76 establishments) with State Office Will be fully implemented Q3 2012 (October 2012)
ICT usage in businesses, 2010 • First time collected in the Economic Census • Refers to businesses owning computers • Among the sectors, 68.4% of ICT usage are in the services sector • Source : Economic Census 2011 • Based on ITU Core ICT Indicators
ICT usage in businesses, 2010(selected industry) Source : Economic Census 2011