Download
1 / 1
10 likes | 146 Views
Period 1. washout. Period 2. washout. Period 3. Period 1. Period 2. washout. Model-based characterization of dose-response relationship in exploratory clinical development – extracting a small signal from noisy response data

E N D
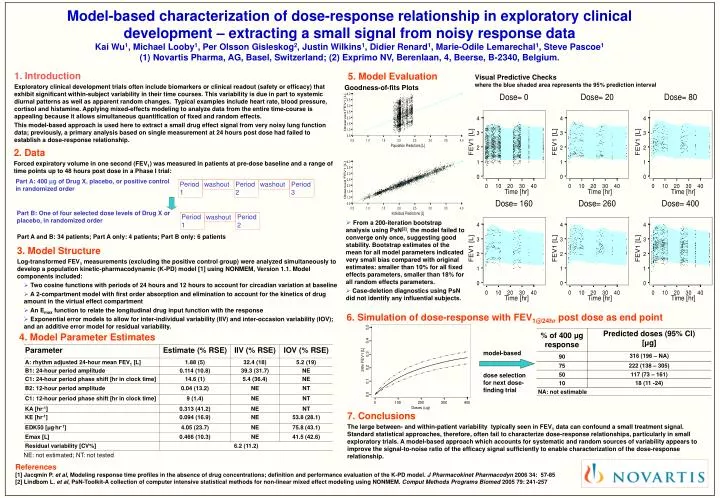
Period 1 washout Period 2 washout Period 3 Period 1 Period 2 washout Model-based characterization of dose-response relationship in exploratory clinical development – extracting a small signal from noisy response data Kai Wu1, Michael Looby1, Per Olsson Gisleskog2, Justin Wilkins1, Didier Renard1, Marie-Odile Lemarechal1, Steve Pascoe1 (1) Novartis Pharma, AG, Basel, Switzerland; (2) Exprimo NV, Berenlaan, 4, Beerse, B-2340, Belgium. 1. Introduction Exploratory clinical development trials often include biomarkers or clinical readout (safety or efficacy) that exhibit significant within-subject variability in their time courses. This variability is due in part to systemic diurnal patterns as well as apparent random changes. Typical examples include heart rate, blood pressure, cortisol and histamine. Applying mixed-effects modeling to analyze data from the entire time-course is appealing because it allows simultaneous quantification of fixed and random effects. This model-based approach is used here to extract a small drug effect signal from very noisy lung function data; previously, a primary analysis based on single measurement at 24 hours post dose had failed to establish a dose-response relationship. 5. Model Evaluation Visual Predictive Checkswhere the blue shaded area represents the 95% prediction interval Goodness-of-fits Plots 2. Data Forced expiratory volume in one second (FEV1) was measured in patients at pre-dose baseline and a range of time points up to 48 hours post dose in a Phase I trial: Part A: 400 μg of Drug X, placebo, or positive control in randomized order Part B: One of four selected dose levels of Drug X or placebo, in randomized order • From a 200-iteration bootstrap analysis using PsN[2], the model failed to converge only once, suggesting good stability. Bootstrap estimates of the mean for all model parameters indicated very small bias compared with original estimates: smaller than 10% for all fixed effects parameters, smaller than 18% for all random effects parameters. • Case-deletion diagnostics using PsN did not identify any influential subjects. Part A and B: 34 patients; Part A only: 4 patients; Part B only: 6 patients • 3. Model Structure • Log-transformed FEV1 measurements (excluding the positive control group) were analyzed simultaneously to develop a population kinetic-pharmacodynamic (K-PD) model [1] using NONMEM, Version 1.1. Model components included: • Two cosine functions with periods of 24 hours and 12 hours to account for circadian variation at baseline • A 2-compartment model with first order absorption and elimination to account for the kinetics of drug amount in the virtual effect compartment • An Emax function to relate the longitudinal drug input function with the response • Exponential error models to allow for inter-individual variability(IIV)and inter-occasion variability (IOV); and an additive error model for residual variability. 6. Simulation of dose-response with FEV1@24hr post dose as end point 4. Model Parameter Estimates model-based dose selection for next dose-finding trial 7. Conclusions The large between- and within-patient variability typically seen in FEV1 data can confound a small treatment signal. Standard statistical approaches, therefore, often fail to characterize dose-response relationships, particularly in small exploratory trials. A model-based approach which accounts for systematic and random sources of variability appears to improve the signal-to-noise ratio of the efficacy signal sufficiently to enable characterization of the dose-response relationship. NE: not estimated; NT: not tested References [1] Jacqmin P. et al, Modeling response time profiles in the absence of drug concentrations; definition and performance evaluation of the K-PD model. J Pharmacokinet Pharmacodyn 200634: 57-85 [2] Lindbom L. et al, PsN-Toolkit-A collection of computer intensive statistical methods for non-linear mixed effect modeling using NONMEM. Comput Methods Programs Biomed 200579:241-257