Download

1 / 10
100 likes | 210 Views
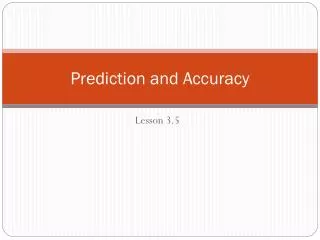
Aim and prediction. I have Written an aim which starts with: To find out .. To investigate … To discover … Written a prediction that includes the word because . E.g. I think that … because …. Method. I have Written in the imperative Used bullet points or numbers for the steps

E N D
Aim and prediction I have • Written an aim which starts with: • Tofindout.. • Toinvestigate… • Todiscover… • Written a predictionthatincludesthewordbecause. E.g. I thinkthat… because….
Method I have • Written in the imperative • Usedbulletpointsornumbersforthesteps • Mentionedhowtobesafe Goodmethodverbs: Take, put, measure, pour, add, heat, weigh…
Variables I have written all three variables: • Independent (what I change) • Dependent (what I measure) • Control (how I willmaketheexperimentfair) • I haveincluded at leasttwo control variables
Diagram I have • Used a ruler • Used pencil • Labeled the equipment with a straight line • Drawn everything in 2D • Drawn the diagram in at least half a page of my notebook
Equipment I have • Listed all the equipment I have used • Used scientific names of the equipment • Said WHY I chose each piece of equipment
Results table I have • Put the independent variable in the left column • Putthedependent variable in therightcolumn • Repeatedtheexperiment • Takenaverages • Putunits at the top of thecolumn • Used a ruler
Bar chart I have • Used mm graph paper • Put the independent variable on the x axis and the dependent variable on the y axis • Written a title • Underlined the title with a ruler • Drawn the axes with a ruler • Labeled the axes • Labeled the y axis with units • Used a regular increase on the y axis (e.g. 2,4,6 NOT 1,3,4,7) • Drawn all the bars the same width
Line graph I have • Used mm graph paper • Written a title • Underlined the title with a ruler • Drawn the axes with a ruler • Put the independent variable on the x axis and the dependent variable on the y axis • Labeled the axes • Labeled the axes with units • Used a regular increase on the axes (e.g. 2,4,6 NOT 1,3,4,7) • Used crosses for the data points • Drawn a line of best fit (curved or straight)
Conclusion I have • Described what I have found out • Explainedwhat i foundout • Describedifthereis a patterne.g. if … increasesthen … decreases • Usedscientificvocabulary • Writtenifthere are anystrange (anomylous) results
Evaluation I have • Tried to explain any anomalous results (why did they happen? • Said whatisgoodabout my method • Said how I can improve my method • Writtenaboutanyotherexperiments I could do in thefuturetoinvestigate more • Writtenaboutworking in a team