Download
1 / 45
460 likes | 604 Views
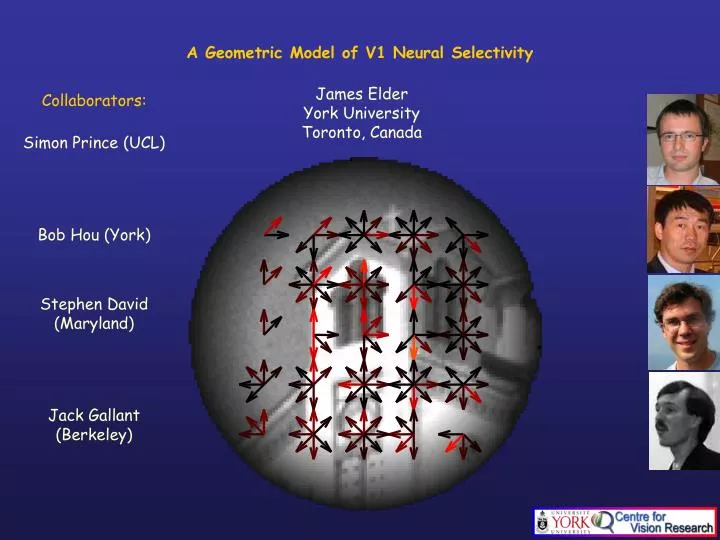
A Geometric Model of V1 Neural Selectivity. Collaborators: Simon Prince (UCL) Bob Hou (York) Stephen David (Maryland) Jack Gallant (Berkeley). James Elder York University Toronto, Canada. Hubel & Wiesel, c. 1968. Simple Cell: Standard Model (Hubel & Wiesel 1959, Movshon et al., 1978,…).

E N D
A Geometric Model of V1 Neural Selectivity Collaborators: Simon Prince (UCL) Bob Hou (York) Stephen David (Maryland) Jack Gallant (Berkeley) James Elder York University Toronto, Canada
Simple Cell: Standard Model (Hubel & Wiesel 1959, Movshon et al., 1978,…)
Energy Model of Complex Cells (Movshon et al., 1978, Adelson & Bergen, 1985)
Stimuli: Gratings (Movshon et al., 1978; Ringach et al., 1997; …)
Simple and Complex Cell Populations in V1 (Skottun et al., 1991) ‘simple’ ‘complex’
The distribution of cells in V1 forms a continuum from ‘purely simple’ to ‘purely complex’ (Movshon et al., 1978; Dean & Tolhurst, 1983; Mechler & Ringach, 2002, Priebe et al., 2004; Mata & Ringach, 2005). Intermediate cells are not well-approximated by standard models for either extreme. In the monkey, spike-triggered covariance analysis suggests convergence of multiple spatially shifted subunits (Rust et al., 2005). Under natural viewing conditions, neuronal responses deviate from predictions of model (David et al., 2004). Limitations of the Standard Models
Natural Scene Stimuli (Gallant et al. 2002; Ringach et al. 2002;…)
Neural Data (Gallant Lab, Berkeley) • Extracellular activity recorded from parafoveal V1 in awake behaving male macaque.
3 5 m s 4 9 m s 6 3 m s 7 7 m s 9 1 m s 1 0 5 m s Linear Regression Estimation of RFs from Natural Stimuli
Natural images are lowpass Estimated receptive fields must be normalized by the stimulus autocorrelation matrix to to correct for second-order correlations in the stimuli. Normalization must be regularized to limit noise Normalization (Theunissen et al., 2001; Willmore & Smyth, 2003)
3 5 m s 4 9 m s 6 3 m s 7 7 m s 9 1 m s 1 0 5 m s Phase-Separated Fourier Model: A Real Cell
In the monkey, spike-triggered covariance analysis suggests convergence of multiple spatially-shifted subunits (Rust et al., 2005). Receptive fields are difficult to interpret Limitations of Fourier Methods
A Different Approach:Neural Selectivity as a Substrate for Geometric Computation
Foundations Zucker, S.W. (1985), Early orientation selection: Tangent fields and the dimensionality of their support
Tangent support fields: computer vision (Zucker et al., 1980s) • Applications: • Contour analysis • Texture analysis • Shading analysis
Tangent support fields: natural image statistics Sequence statistics (Elder & Goldberg, 2002) Set statistics (Geisler et al., 2001)
Tangent Field Estimation Multi-scale method R2S1 Pooling Optimize spatial and orientation sampling using cross-validation Reverse Correlation Optimize over 2 different temporal windows using cross-validation Normalization Fixed parameters Methods
3 2 1 0 -1 -2 -3 gradient direction R2S1 representation stimulus local pooling gradient magnitude Constructing the R2S1 (x,y,Θ) representation
Local Image Descriptors for Object Recognition in Computer Vision y y x x SIFT Descriptor (Lowe, 2005)
Natural image sequence Gradient magnitude and direction R2S1 representation Cell response (spikes) Reverse correlation on the R2S1 representation Time
We correct for stimulus bias over time using an SVD method that zeros coefficients associated with small eigenvalues (Theunissen et al., 2001; David et al., 2004) over space using regularized normalization (ridge regression: Press et al., 1992; Willmore & Smyth 2003) Normalization
C O M P L E X C E L L O T H E R S I M P L E C E L L O r i e n t a t i o n t u n e d r e c e p t i v e f i e l d O r i e n t a t i o n t u n e d r e c e p t i v e M o r e e x o t i c c e l l r e s p o n s e s w i t h d i s t i n c t s p a t i a l a r e a s f i e l d , r e s p o n d s t o c o n t o u r s o f c a n a l s o b e d e s c r i b e d , s u c h r e s p o n d i n g t o e d g e s o f d i f f e r e n t e i t h e r p o l a r i t y r e g a r d l e s s o f a s s e l e c t i v i t y f o r t h i s c u r v e d p o l a r i t y . p o s i t i o n . e d g e s e c t i o n . What types of cell can be represented?
7 m s 2 1 m s 3 5 m s 4 9 m s 6 3 m s 7 7 m s 9 1 m s 1 0 5 m s 1 1 9 m s 1 3 3 m s Example V1 Receptive Field 2 r 2 2 1 , r = 0 . 3 0 9 1 2
2 r 0 2 1 0 , r = 0 . 2 3 6 0 5 2 r 2 8 4 , r = 0 . 0 9 9 1 6 Example V1 receptive fields 3 5 m s 4 9 m s 6 3 m s 7 7 m s 9 1 m s 1 0 5 m s E D G E D E T E C T I O N 3 5 m s 4 9 m s 6 3 m s 7 7 m s 9 1 m s 1 0 5 m s
Example V1 receptive fields 2 r 3 0 1 , r = 0 . 2 1 8 4 9 3 5 m s 4 9 m s 6 3 m s 7 7 m s 9 1 m s 1 0 5 m s 2 r 3 0 5 , r = 0 . 1 6 5 9 9 C O R R E L A T I O N R E S U L T S 3 5 m s 4 9 m s 6 3 m s 7 7 m s 9 1 m s 1 0 5 m s
0.6 0.5 0.4 R2S1 Pearson Correlation (r) 0.3 PSFFT 0.2 0.1 0 210a r221a r0284 r0287 r0301 r0305 Mean Neuron Results (small dataset)
0.7 0.6 0.5 R2S1 0.4 Linear Pearson Correlation (r) PFFT 0.3 PSFFT 0.2 0.1 0 Mean r0206B r0210A r0211A r0220A r0221A r0222A r0223A r0208D r0225C r0212B r0217B r0219B Neuron Results (large dataset) Bonferroni-corrected planned comparisons (R2S1 vs each of the other models) not significant.
A geometric model for V1 neural selectivity A unified framework for modeling cells over the full range of the simple/complex continuum. Allows spatial subunit structure to be expressed Visualization is intuitive and evocative Provides a bridge to geometric computations required for perceptual organization, shape perception, etc. May generalize to extrastriate areas Summing Up
Normalized Amplitude (R221A_Andros) cropFraction: 1 rfsize: 48 nxy: 5 ntheta: 8 gamma: 1 neigs: 60 maxlag: [0 10] ncrossval: 9 ftrs: [2 5] cc = 0.44
Normalized Gradient (R221A_Andros) cropFraction: 1 rfsize: 48 nxy: 5 ntheta: 8 gamma: 1 neigs: 60 maxlag: [0 10] ncrossval: 9 ftrs: [2 5] cc = 0.44
Normalized Amplitude (R221A_New) cropFraction: 1 rfsize: 60 nxy: 5 ntheta: 16 gamma: 1 neigs: 60 maxlag: [0 10] ncrossval: 5 ftrs: [2 5] cc = 0.592
Normalized Gradient (R221A_New) cropFraction: 1 rfsize: 60 nxy: 5 ntheta: 16 gamma: 1 neigs: 60 maxlag: [0 10] ncrossval: 5 ftrs: [2 5] cc = 0.592
Linear Cannot represent invariance to position, phase, contrast polarity What are the equivalence classes? FFT Cannot represent specificity to position, phase, contrast polarity, (curvature ?),… What are the equivalence classes PSFFT Represents a continuum between linear and FFT Allows representation of intermediate neurons Is this the ‘natural’ continuum or manifold? What does ‘intermediate’ mean here? Can we represent partial invariances? Can’t represent ‘tolerances’ in stimulus properties (e.g., position, phase, …) Can’t represent spatial substructure of complex cells Model Comparison
R2S3 model Can represent invariances semi-locally Can represent tolerances in selectivity to stimulus features Can represent spatial substructure of complex cells Still cannot represent strong spatial interactions Model Comparison