Download
1 / 18
180 likes | 333 Views
Gone Fishin’: Effects of Nutrient Loading on Food Webs. The Tsunami Group “ A Wave of Change †Facilitator: Leesa Sward with P. Bologna, S. Chamberlin, J. Kastler, B. Livingston, N. McHenry, K. Rosenfeld. Description of Concept and Course.

E N D
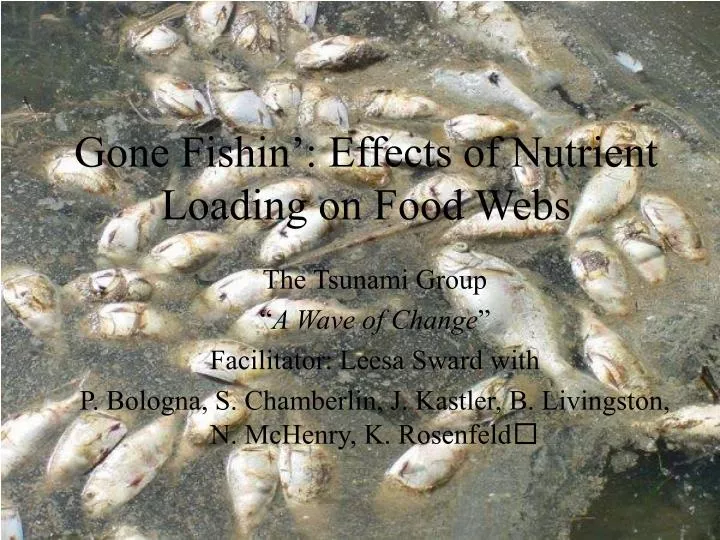
Gone Fishin’: Effects of Nutrient Loading on Food Webs The Tsunami Group “A Wave of Change” Facilitator: Leesa Sward with P. Bologna, S. Chamberlin, J. Kastler, B. Livingston, N. McHenry, K. Rosenfeld
Description of Concept and Course • This unit could be taught in any 100-200 level course on Ecology, Oceanography, Environmental Science, or Biology either in class or in a distance learning environment. • The activities are appropriate for any number of students from a very small class to a very large one. • This unit would take place within a larger unit on aquatic productivity but would be equally well placed within a unit on anthropogenic influences on the environment.
Learning Goals/Objectives • The student will be able to explain potential relationships between nutrient levels and food web structure (Summative, CAT III – Discipline-Specific Knowledge and Skills) • The student will demonstrate problem solving skills (CAT I: Higher Order Thinking Skills) • The student will develop the ability to work productively with others and improve ability to follow directions, instructions, and plans (CAT V: Work and Career Preparation) • The student will be able to analyze and synthesize data (CAT I: Higher Order Thinking Skills)
Teaching Challenges • Students express a fundamental misconception that “more nutrients is better.” • Students fail to recognize indirect links between trophic levels (e.g., Gallegos et al. 1994) and rarely consider the effects of abiotic factors. • Student do not understand eutrophication as a cause and consequence of water pollution (e.g., Hogan 2000).
Teaching Strategies • This unit explores the relationship between nutrient concentrations and food web structure using a game-based simulation of nutrient loading in a 3-level aquatic food chain. • Students generate hypotheses and acquire data to support or reject their hypotheses. • Through this activity students address preconceptions and construct new knowledge. • Students demonstrate knowledge transfer by applying their knowledge in a new situation.
Lesson Plan • 5 -10 minutes – Introduction. • Entire class generates hypotheses related to how many fish can be caught when you have various levels of nutrients. • 30 minutes – Nutrient and Aquatic Food Web game with directed questions • Introduction/Rules of the game. • Break class into groups of 5. • Run the game 5 times. • 15 minutes – Each group reports to the class what happened in their group – revisits hypotheses. • 20 minutes – Instructor directed class discussion/lecture to wrap up. • 5 minutes – Minute paper to assess objectives.
Assumptions • We assume that students have already been exposed to basic ecological terms. • Students are familiar with food web structure. • Students have a basic knowledge of aquatic productivity.
Now that you have come up with some ideas, let’s turn these into some possible hypotheses regarding the relationship between nutrient levels and aquatic ecosystems. Let’s go fishing. We are going to examine several different fishing habitats as well as their changing nutrient load over time. It is your job to determine when you might catch the most fish. If low nutrient input, then ... If high nutrient input, then…
What Have We Learned? • Nutrient concentrations drive phytoplankton productivity. • Zooplankton and fish populations increase as phytoplankton grow but… • Too many phytoplankton cause conditions that remove oxygen, leading to…<you fill in the blanks>
Limitations of Simulation • Does not account for • Physical stratification • Sources and sinks of oxygen • Roles sedimentation, organic material & bacteria. • Benthos and bottom-feeding fish, the groups most affected by low oxygen.
Look at what scientists found! Source: NOAA, 1999
Lesson Extension 1 • Give students a version of the simulation with a moderate level of nutrient loading. • Compare results across groups and assess whether results support the hypotheses they generated in the minute paper.
Lesson Extension 2 • Take classroom data home to graph. • Run Excel model simulations. • Adapt Excel model for online delivery.
In Conclusion… • Active learning embeds concepts and helps students retain information. • Case studies invite discussion and knowledge transfer. • Classroom implementation with assessment will be used to test and revise unit for our classrooms.