Download
1 / 16
160 likes | 259 Views
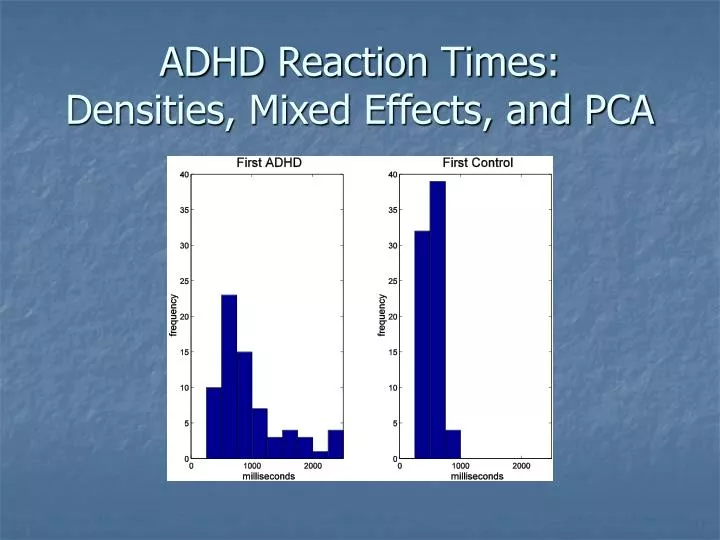
ADHD Reaction Times: Densities, Mixed Effects, and PCA. ADHD: Attention Deficit (Hyperactive) Disorder. ADHD kids have difficulty in focusing on tasks. But true ADHD is rarer than is generally believed, and drug treatments are used much too often. How can we correctly identify ADHD children?.

E N D
ADHD: Attention Deficit (Hyperactive) Disorder • ADHD kids have difficulty in focusing on tasks. • But true ADHD is rarer than is generally believed, and drug treatments are used much too often. • How can we correctly identify ADHD children?
Reaction Time Experiment • 17 ADHD children • 16 age-matched controls • “Warning of cue” appears on computer screen. • Delay of about 10 seconds. • Cue actually appears. • Measure the time it takes to react to the cue. • Repeat and get about 70 reaction times for each child. • Longer reaction times for ADHD than for controls. But what do they look like? How to quantify?
How do reaction times differ between ADHD and controls? • ADHD child has many reaction times beyond 1 sec. Not so for control. • How can we represent histogram as a smooth density? • What are differences in shape, mean, mode, etc., between groups? • How can we account for child-to-child differences when comparing the groups?
How can we represent the histogram as a smooth curve? • Simple answer: Find the probability density function using standard methods. • Problem with that: Standard textbook densities don’t capture characteristics like • Initial lag • Extreme peak immediately after lag • Long right tail with many outliers • New answer: Use flexible modeling of density functions to create a functional data object
How can we create a functional density object from a histogram? • Use tools from before: • Basis expansion: linear combination of splines • Roughness Penalty: making explicit the competing goals • Basis expansion with • 34 B-splines of order 5 • Equally spaced knots • Competing goals are • Fitting density curve exactly to histogram • Wanting curve to be close to a normal density
What about the constraints of a probability density function? • Constraints: • P(t) > 0 over interval of interest. • Area under the curve is 1. • New tool: Transformation. • For any function W(t), can build a density function: p(t) = C exp{W(t)}, for C = appropriate function of W. • Transforms estimation problem from constrained p(t) to unconstrained W(t)!
Hey, the original data aren’t really functional, are they? • Idea again: Transformation. • The functional object is really indirectly related to the data. • Data: reaction times t – nonfunctional • What we want: reaction time densities p(t) – functional • Related through
What do the group densities look like? • Definite shift in mode between groups. • Bimodality, or even trimodality? • ADHD has large shoulder and long tail. • But what about individual differences in children?
Are there inter-child differences? Examples of four ADHD children: • Dashed line is group density for ADHD. • Solid line is individual density for child. Definite child-to-child variability. Shouldn’t ignore this.
How can we estimate the densities and account for individual differences? • Transform first: • Subtract 120 from each reaction time • Initial dead period not helpful • Logarithm • Effects are likely multiplicative, not additive • Z = log10(t-120) Functional Mixed Effects Linear Model
Build mixed effects model Child i; trial j; group k Zijk = transformed reaction time density (functional) μk = typical performance of all children in group k (functional) αi|k = individual performance of child i within group k (functional) Uijk = leftover variation in density (functional) What is our functional mixed effects model? Zijk = μk + αi|k + Uijk ∑ αi|k = 0
ADHD have greater variability in residuals. • ADHD have greater mean residuals (952 vs 645 msec). • Modality an artifact of instruments.
How can we explore variability across subjects within a group? Functional Principal Components Analysis • Goal: • explore how densities change from child to child. • Idea: • Principal components (harmonics)are like empirical basis functions. Want to expand our densities with these harmonics. • Problem: • Hard to ensure that the densities are positive. • Solution: • Transformation! Explore the derivatives instead.
What do the harmonics look like? • Used weighted fPCA • minimizes importance of variation when density is small. • Back-transformed • to get harmonics in original density scale. • Harmonic Interpretations: • 1st : More weight on central peak. • 2nd : More weight on early reaction times. • 3rd : Highlights periodic effect from instrumentation.
What have we learned? • Transformations • The functional object can be indirectly related to the data, such as the probability density function • Functional Linear Model • Can add random effects • Functional Principal Components Analysis • Can be done on a transformation, such as the log density derivative