Download
1 / 13
130 likes | 278 Views
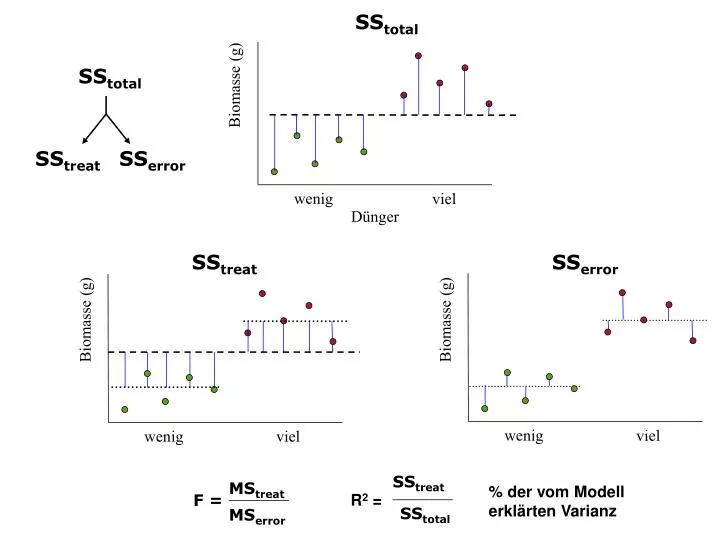
SS total. SS treat. SS error. SS treat. % der vom Modell erklärten Varianz. R 2 =. SS total. MS treat. F =. MS error. SS total. Biomasse (g). wenig. viel. Dünger. SS treat. SS error. Biomasse (g). Biomasse (g). wenig. viel. wenig. viel. Statistische Schlussfolgerung.

E N D
SStotal SStreat SSerror SStreat % der vom Modell erklärten Varianz R2 = SStotal MStreat F = MSerror SStotal Biomasse (g) wenig viel Dünger SStreat SSerror Biomasse (g) Biomasse (g) wenig viel wenig viel
Statistische Schlussfolgerung H0 abgelehnt H0 nicht abgelehnt Unterschiede vorhanden type II error Wahre Situation nicht vorhanden type I error Schlussfolgerungen beim prüfen von Nullhypothesen Test ist signifikant: die Gruppen gehören mit Irrtumswahrscheinlichkeit p zu unterschiedlichen Grundgesamtheiten (solchen mit unterschiedlichen Mittelwerten) Test nicht signifikant: kein Beweis, dass Gruppen gleich sind! The absence of a proof is not proof for an absence!
Statistische Macht (statistical power) Wahrscheinlichkeit mit der eine Nullhypothese, die effektiv falsch ist, abgelehnt werden kann. Abhängig von: • Grösse der Unterschiede zwischen Gruppen (effect size) • Stichprobenumfang (sample size) • Ausmass der Streuung innerhalb der Gruppen (error variance)
Hilfe meine Daten sind nicht normalverteilt! Datentransformation bes. bei kontinuierlichen Daten bes. bei Zähldaten bes. bei Prozentwerten Annahmen der ANOVA • Residuen sind normalverteilt • gleiche Streuung in jeder Gruppe • Datenpunkte sind unabhängig
6 5 4 3 2 1 0 Beispiel: one-way ANOVA with 3 levels (fertilizer) Biomasse 1 2 3 Dünger Nullhypothese: ALLE Gruppen haben den gleichen Mittelwert Alternativhypothese: einer oder mehrere dieser Mittelwerte sind unterschiedlich
Regression: Linearer Zusammenhang zwischen kontinuierlichen Variablen variable 2 variable 2 variable 1 variable 1 variable 2 variable 1 Geradengleichung: y = a + bx
Alternativhypothese: b≠0 Nullhypothese: b=0 y x SSregression MSregression % der vom Regressionsmodell erklärten Varianz R2 = F = SStotal MSerror Geradengleichung: y = a + bx y x
Regression: Interpretation Seedling size = 33.052541 + 13.915626 seed mass
Prüfen von Hypothesen bei ANOVA und Regression: ANOVA: Gruppen haben unterschiedliche Mittelwerte? Regression: Steigung der Gerade ist ungleich null? ANOVA und Regression können kombiniert werden: ANCOVA (analysis of covariance) Kontinuierlicher Faktor nennt man dann Kovariable (covariate) Mehr als ein Faktor im Modell: multi-way ANOVA
Factorial ANOVA Faktoren werden kombiniert Faktor A 1 2 1 Faktor B 2
Scenario 1 Scenario 2 fertilised fertilised Biomass Biomass control control long short long short photoperiod photoperiod ANOVA: ANOVA: Photoperiod Photoperiod Fertilizer Fertilizer * * Photoperiod x Fertilizer Photoperiod x Fertilizer ns * ns ns
Scenario 4 Scenario 3 fertilised fertilised Biomass Biomass control control long short long short photoperiod photoperiod ANOVA: ANOVA: Photoperiod Photoperiod Fertilizer Fertilizer * ns Photoperiod x Fertilizer Photoperiod x Fertilizer ns * * *
Experimentelles Design Wichtigeste Punkte zu beachten: • Zufällige Zuordnung zu Behandlungen! • Zufällige räumliche Anordnung der Behandlungsgruppen! • Keine Pseudoreplikation! Wichtigste experimentelle Designs: • Completely randomised design • Randomised complete block design • Split-plot design