Download
1 / 37
560 likes | 920 Views
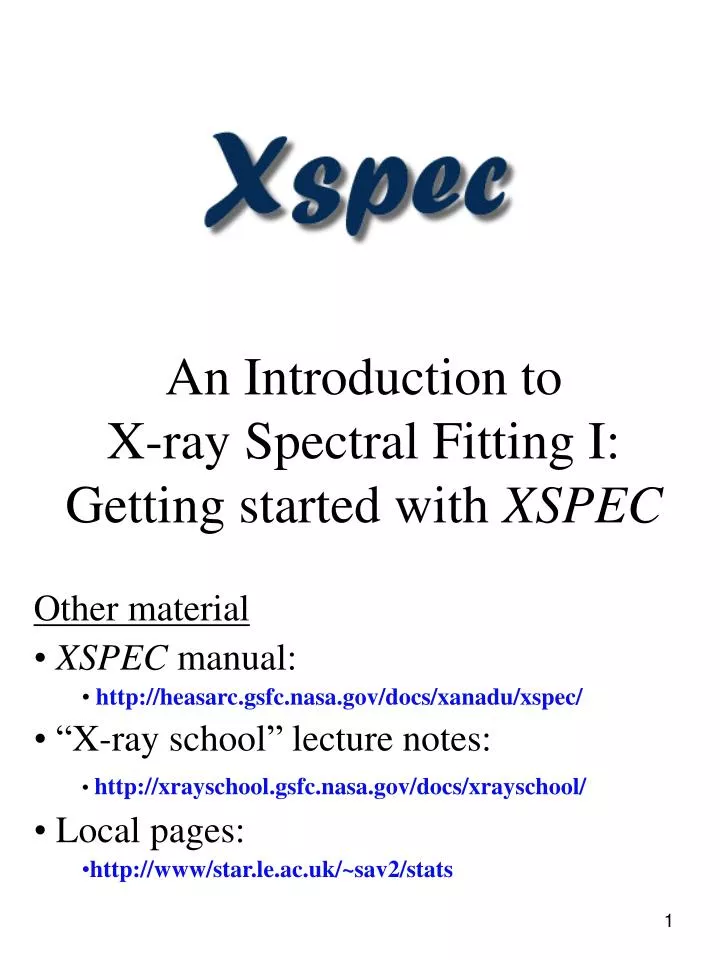
An Introduction to X-ray Spectral Fitting I: Getting started with XSPEC. Other material XSPEC manual: http://heasarc.gsfc.nasa.gov/docs/xanadu/xspec/ “X-ray school” lecture notes: http://xrayschool.gsfc.nasa.gov/docs/xrayschool/ Local pages: http://www/star.le.ac.uk/~sav2/stats.

E N D
An Introduction toX-ray Spectral Fitting I: Getting started with XSPEC Other material XSPEC manual: http://heasarc.gsfc.nasa.gov/docs/xanadu/xspec/ “X-ray school” lecture notes: http://xrayschool.gsfc.nasa.gov/docs/xrayschool/ Local pages: http://www/star.le.ac.uk/~sav2/stats
Syllabus Part I: • What is spectral fitting? Why? • How to compare data and model • Running XSPEC • Fitting a model to data • Fitting non X-ray data (e.g. optical) • Simulating data Part II: • How to test the fit • Confidence regions (uncertainties) • Comparing different models • Few count/bin spectra • Reference material
Why spectral fitting? • The recorded spectrum is not the true spectrum of the source: • instrumental response • errors (uncertainties, e.g. Poisson noise) • To test a physical model (e.g. blackbody) against data and make statistical inferences.
The detector response As an observer, what you get is counts per detector channel, C(i): T is the observation length (in s) A(E) is the effective area of the telescope + detector (in cm2). R(i,E) is the redistribution: the probability of photon with energy E being recorded in channel i. S(E) is the true spectrum (in units of photons/s/cm2/keV)
Redistribution: line spread No detector is perfect. In real life the spectrum you get out is not exactly what you put in. This plot shows the energy redistribution of an EPIC camera from XMM-Newton. This is the detector output from a monochromatic (6.4 keV) input. This limits the energy resolution.
The response matrix The response (or redistribution) matrix R(i, E) gives the probability that a photon with energy E will be detected in channel i.
Effective area • The effective collecting area of the telescope and detector as function of energy. • Product of : • detector efficiency, • mirror reflectivity, • mirror geometrical cross-section…
“uncertainties”: X-ray data X-ray detectors record individual X-ray events – “counts” – per detector channel. These are subject to Poisson (counting) statistics, i.e. the number of counts is drawn from the distribution: This gives the probability of observing exactly C (integer) counts if μ is the expected number (true flux). As the number of counts increases this distribution converges to the familiar Gaussian distribution with a mean of μiand a one sigma “error” of μi. For an observed number of counts Ci we assign the familiar standard deviation Ci.
Poisson vs. Gauss Comparison of Poisson distribution (dotted) with Gaussian distribution (solid curve) having the same mean and variance. Rule of thumb: Poisson distribution is usually ‘close enough’ to Gaussian when μ>20. Common practice to bin data such that there are ~20 ct/bin in a spectrum, e.g. using “grppha” μ=5 μ=10 μ=20 μ=50
The forward fitting method Cannot invert the observed counts-channel spectrum to useful flux-energy spectrum – no unique solution, very noisy, etc… So convert the model instead! Define model Calculate model Convolve with response Change model parameters Compare to data
Fit statistics: How to compare data and model The most used measure of the “goodness” of a fit is Pearson’s chi-square statistic – χ2 – which measures the variance (sum of squares) of the “residuals” (i.e. data minus model) where σ(i) is the error on the counts in channel i andμ(i) is the folded model, i.e. including detector response. A smaller χ2 means a better fit (i.e. smaller data-model differences).
Multi-mission spectral fitting packages • XSPEC (from GSFC/NASA) • Part of HEAsoft • Been around since 1983/1986 • The de facto standard • Many spectral models • Sherpa (from CXC) • http://cxc.harvard.edu/sherpa • Part of CIAO (for Chandra) • Uses XSPEC model library • Some advanced stats routines • Multi-dimensional fitting • ISIS (from MIT) • http://space.mit.edu/CXC/ISIS • Distributed computation • Highly programmable • Uses XSPEC model library • SPEX (from SRON) • Specialised for high-resolution plasma modelling
Using XSPEC • Loading data • Generating a model • Fitting the model to data • Saving what you have done • Plotting your results • Using multiple datasets • Simulating data • Examples of real data
Input files The data: • Source spectrum gives the counts per channel (*.pha) • Background spectrum (*.pha) The instrument: • Detector “response matrix” – conversion from photons at energies to counts in channels (*.rmf) • “Ancillary” response file (*.arf) –effective area of detector NB: Sometimes: rmf+arf = *.rsp
First steps with XSPEC • lhea-setup-new(initialise) • xspec (start XSPEC) • data spec.pha (load spectrum) • back back.pha(background) • resp resp.rmf(redist. matrix) • arf resp.arf(ancillary resp.) • cpd /xs (set plot device) • setplot energy (plot in keV) • ignore **-0.5 10.0-** • plot data (plot data) • show (data info) (NB: The initialisation command may change)
Non X-ray data • XSPEC can be used to fit any binned, 1-dimensional dataset • optical spectra, power spectrum, … • Use the tool flx2xsp to convert from ASCII file to XSPEC files • Input ASCII file in 4 columns • E_low(i) • E_high(i) • Flux(i) i.e. flux density * [E_high-E_low] • Error(i) • Ensure bins are contiguous • i.e. E_high(i) = E_low(i+1) • Output is a spectrum (*.pha) and a ‘dummy’ response file (*.rsp) ready to load into XSPEC • Although XSPEC works in energy units, your data do not need to be in energy bins… (rename the axis)
X-ray spectral models X-ray spectral models are built up from smaller components. There are two main types of model component: • Additive models – emission components, e.g. blackbody or emission line. • Multiplicative models – modifies the emission spectrum, e.g. absorption by neutral gas
Example models Frequently used additive models: • Power law (pow) • Blackbody (bb) • Bremsstrahlung (bremss) • Collisional plasma (mekal) • Gaussian emission line (gaus) • More detailed models such as Compton scattering, thermal accretion disc, … Frequently used multiplicative models: • Photoelectric absorption due to neutral gas, e.g. in our Galaxy (wabs, phabs, TBabs) • Photoelectric absorption due to ionized (“warm”) gas (absori) • Individual photoelectric edges (edge) and absorption lines (gabs) • Exponential roll-over (expabs)
Building a model • model wabs*(pow) • wabs = neutral absorption (NH) • pow = power law (Γ, N) • editmod wabs*(pow+gaus) • gaus = Gaussian (E, σ, N) • plot model
Fitting a model Adjust model parameters to minimise χ2 • fit Plot data (in log-space) andΔχresiduals • plot ldata del
XSPEC12>model mekal Input parameter value, delta, min, bot, top, and max values for ... 1 0.01 0.0808 0.0808 79.9 79.9 mekal:kT>9 0.01 1 -0.01 1e-06 1e-05 1e+19 1e+20 mekal:nH> 1 -0.01 0 0 1000 1000 mekal:Abundanc>0.5 0.001 0 -0.01 0 0 10 10 mekal:redshift>0.25 1 switch mekal:switch> 1 0.01 0 0 1e+24 1e+24 mekal:norm> ================================================= Model mekal<1> Source No.: 1 Active/On Model Model Component Parameter Unit Value par comp 1 1 mekal kT keV 9.00000 +/- 0.0 2 1 mekal nH cm-3 1.00000 frozen 3 1 mekal Abundanc 0.500000 +/- 0.0 4 1 mekal redshift 0.250000 frozen 5 1 mekal switch 1 frozen 6 1 mekal norm 1.00000 +/- 0.0 _______________________________________________________ Chi-Squared = 3.966551e+08 using 750 PHA bins. Reduced chi-squared = 530997.4 for 747 degrees of freedom Null hypothesis probability = 0.000000e+00
XSPEC12>fit Chi-Squared Lvl Par # 1 3 6 819.316 -3 7.02352 0.308761 0.0105194 802.042 -4 7.09851 0.347419 0.0105871 802.042 -5 7.09814 0.347367 0.0105868 ================================================= Variances and Principal Axes 1 3 6 2.95E-09 | 0.00 0.00 -1.00 1.44E-02 | -1.00 0.02 0.00 4.44E-04 | -0.02 -1.00 0.00 ----------------------------------------- ================================================= Covariance Matrix 1 2 3 1.443e-02 -2.200e-04 -6.073e-06 -2.200e-04 4.479e-04 -1.034e-06 -6.073e-06 -1.034e-06 8.361e-09 ------------------------------------------ ================================================= Model mekal<1> Source No.: 1 Active/On Model Model Component Parameter Unit Value par comp 1 1 mekal kT keV 7.098 +/- 0.1201 2 1 mekal nH cm-3 1.00000 frozen 3 1 mekal Abundanc 0.3474 +/- 2.116E-02 4 1 mekal redshift 0.2500 frozen 5 1 mekal switch 1 frozen 6 1 mekal norm 1.059E-02 +/-9.144E-05 _______________________________________________________ Chi-Squared = 802.04 using 750 PHA bins. Reduced chi-squared = 1.0737 for 747 degrees of freedom Null hypothesis probability = 7.962138e-02
Searching χ2-space The parameters of the model θiare varied and the combination that gives the lowest χ2 is the “best fit”. XSPEC uses a ‘local’ search algorithm to find the minimum of the space defined by χ2(θ). Can get lost in local minima. WARNING: Start in a sensible place and experiment with different initial positions.
Searching χ2-space The parameters of the model θiare varied and the combination that gives the lowest χ2 is the “best fit”. XSPEC uses a ‘local’ search algorithm to find the minimum of the space defined by χ2(θ). Can get lost in local minima. WARNING: Start in a sensible place and experiment with different initial positions.
χ2minimisation issues χ2(θ) θ The problem: find min[χ2(θ)] with as few iterations as possible. (Imagine searching 10-dimensional parameter space!) 1) Calculate χ2 at present position. 2) Calculate gradient χ2 based on finite differences i.e. 3) Adjust parameter θiθi+1in direction of lower χ2
χ2minimisation issues -∆θ +∆θ χ2(θ) θ • Make sure you set parameter step sizes to sensible values! • newpar 1 • par1> 2.00 0.01 0.00 0.00 10.00 10.00 Parameter value θ Parameter step size ∆θ Hard & soft minimum Soft & hard maximum
χ2minimisation issues χ2(θ) θ • Watch out for local minima! • Try fitting same model from different initial positions • Perturb the current fit using the “error” command • (This last options forces the parameter “uphill” in χ2 which may push it over and into a better maximum”)
Why is XSPEC so slow? At each iteration XSPEC calculates the gradient of the fit statistic χ2 using: which requires 2P evaluations of χ2 each of which requires a model calculation S(E) followed by a matrix multiplication: So with a 10242 response matrix R and a 6 parameter model that means >107 calculations per iteration (assuming the model is trivial)!
Making plots (using IP) • ip (interactive plotter, uses QDP) • la x <x-axis label> • la y <y-axis label> • la f <filename> • la t <title> • time <on/off> • font <normal/roman/script> • cs <font size, e.g. 1.2> • lw <line width, e.g. 3> • plot • hardcopy /ps, (or /gif etc…) • exit >
Multiple spectra • data 1:1 spec1.pha • resp 1:1 resp1.rmf • data 2:2 spec2.pha • resp 2:2 resp2.rmf XSPEC can fit several spectra simultaneously with the same model. This might be useful if you have, for example, simultaneous observations with Chandra and XMM and you want to use BOTH spectra to constrain the model.
Simulating data You may need to simulate (“fake”) some data, to see how a given model would look during an observation. First define the model and, for a no-background simulation, use: > fakeit none Then enter the response file name(s), the exposure time (in sec) and the output filename. If you want to include a background spectrum (e.g. bkg.pha) in your simulation: > fakeit bkg.pha
Miscellaneous commands • save files <filename.xcm> • save model <filename.xcm> • save all <filename.xcm> • delcomp <no.> (delete model comp.) • freeze <no.> (stop a param. varying) • thaw <no.> (un-freeze param.) • newpar <no.> (modify param.) • flux <Elo> <Ehi> (flux in E band) • cosmo<H0 , q0 , Λ0> (set cosmology) • lum <Elo> <Ehi> <reshift> • setplot<en, wave, chan, …> • plot <d,ld,del,chi,res,uf,m,…> • exit (quit XSPEC)
γ-ray Burst: GRB 031203 • model wabs*pow • fit χ2=160.1 for ν=174 (Prej=29%)
Seyfert galaxy: Mrk 79 • model wabs*(pow+bb+gaus) • freeze 7 (stop line width varying) • fit χ2=492.0 for ν=485 (Prej=68%)
Do try this at home… • A worked example showing exactly how to: • Load data • Set-up a model • Adjust the parameters • Get a good fit • Make plots • Get confidence regions • Examine contour plots • http://www.star.le.ac.uk/~sav2/stats