Download
1 / 17
170 likes | 263 Views
Accuracy v. Precision. Quality of Data Precision: Well-grouped together Results are repeatable Compare to other repeated measurements Accuracy: Close to actual value Compare to correct value. Accuracy v. Precision. Precise – all the hits are close together.

E N D
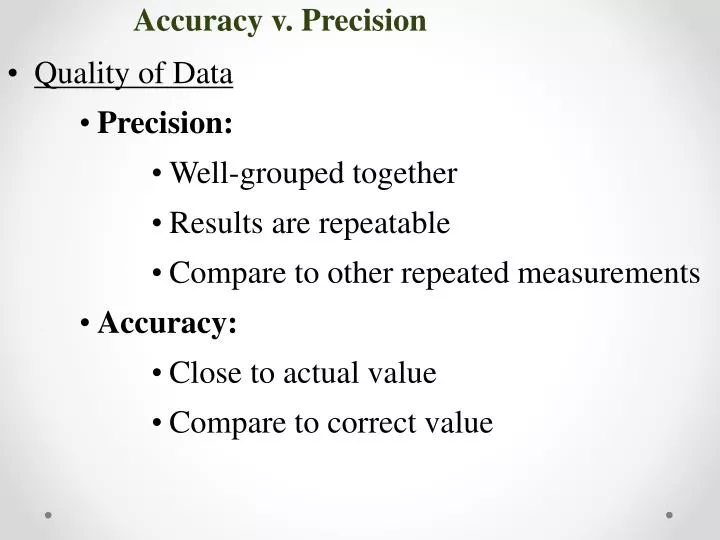
Accuracy v. Precision • Quality of Data • Precision: • Well-grouped together • Results are repeatable • Compare to other repeated measurements • Accuracy: • Close to actual value • Compare to correct value
Accuracy v. Precision Precise – all the hits are close together Not accurate – the hits are not close to bulls eye Not precise – none of the hits are close together Not accurate – none of the hits are close to bulls eye Precise – all the hits are close together Accurate – all the hits are near the bulls eye
2 ways to show accuracy & precision Significant Figures Percent Error
Accuracy with Measurements • Significant Figures : numbers that show precision in measurements • Key question: Is there a decimal? • YES: come from left, 1st number (non-zero) and anything after it is significant • 0.001 ml 4.7200 mL 82.0 sec
Accuracy with Measurements • Significant Figures : numbers that show precision in measurements • Key question: Is there a decimal? • NO: come from right, until you hit a number and everything past it is significant • 5090 dm 7000 meters • * Scientific Notation: don’t count it • 6.02x10²³
Accuracy with Measurements • Significant Figures • Practice: http://science.widener.edu/svb/tutorial/sigfigures.html • Rounding to Significant Figures • 314.721 (four) 0.001775 (two) • 8792 (two) 4.3622x10⁻⁵ (three) • 87.073 (three) 1040 (two) 314.7 0.0018 8800 4.36x10⁻⁵ 87.1 1.0x10³
Accuracy with Measurements • Practical Applications: Estimating in Measurements • Always estimate one decimal place past the actual accuracy of the measuring device’s scale
Accuracy with Measurements • Practical Applications: Estimating in Measurements
Accuracy with Measurements • Significant Figures in Calculations • Multiplication and Division • Answer’s sig figs = least sig figs • Example: 3.126x10-6 x 2.8x10-7 = • 8.8x10⁻¹³
Accuracy with Measurements • Practice! Use your calculator to find the following answers. Report it in scientific notation. Round to the proper amount of sig figs 5.231 x 10⁻⁴ ÷ 1.49 x 104 = 9.62 x 105 x 5.4 x 106 = 2.62x10⁻⁴ ÷ 3.14x10-8 = 7.72x10-2 x 5.74x10-2 = 8.22x10⁻⁵ ÷ 3 x104 = 3.51x10⁻⁸ 5.2x10¹² 8344 = 8.34x10³ .004431 = 4.43x10⁻³ 3x10⁻⁹
Accuracy with Measurements • Significant Figures in Calculations • Addition & Subtraction • Answer’s decimal places = least decimal places • Examples: • 128.112 g – 18.92 g = 109.19 g • 100 g + .01 g = 100 g • 9.27x10⁻⁴ + 9.237x10-5 = 1.019x10⁻³ g • .000927 + .00009237 = .001019 g
Accuracy with Measurements • Practice! Use your calculator to find the following answers. Report it in scientific notation. Round to the proper amount of sig figs 39.64 + 1.3 = 195.4 – 193 = 5.8465x10² + 1.2x103 = 9x10² + 5x102 = 46.8 – 41.4 = 40.9 2 1.8x10³ 1.4x10³ 5.4
WebAssign Hint • Just assume that you should use sig figs from here on out. Also, on the WebAssign, you will see this: This symbol means you must put the correct number of significant figures on web assign (not always 4)
Data Analysis • Percent error: shows how accurate experimental values are by determining how much error they have Actual = correct answer Experimental = what you got
Data Analysis • Practice: The density of silver is 10.49 g/ml. If I measured it to be 11.1 g/ml, what is my percent error? 5.82% error
Data Analysis • Practice: The density of gold is 19.32 g/cm3. What is the percent error of the following experimental measurements? • 20.1 g/cm3 c) 19.7 g/cm3 • 19.51 g/cm3 d) 18.90 g/cm3 4.04 % error 1.97 % error 0.9834 % error 2.174 % error
Accuracy with Measurements • Practice Problems Due tomorrow