Download
1 / 12
120 likes | 122 Views
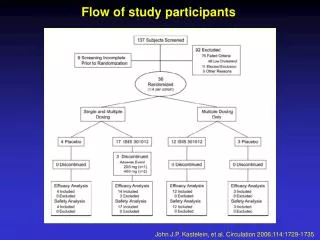
This briefing provides an analysis of flow studies conducted from 1988 to 1990, comparing CSO (Combined Sewer Overflow) with and without suburbs. It evaluates the annual volumes treated and outlines the benefits of the current system for DC and suburban areas.

E N D
Briefing for IMA Participants on Results of Flow Studies October 31, 2006 District of Columbia Water and Sewer Authority
Bases for Analyses • 3-yr runs (average 1988, 1989 1990) • Average flow = COG Round 6.3 • Base flows vary with amount of rain in year • Suburban wet weather relationships = new regression
Service Area Three Evaluation Methods 3. Identify what Suburbs would need to do if not connected to DC CSO system 1. Compare CSO with and without suburbs 2. Annual Volumes Handled With Suburbs (C3-B1) Suburbs up to IMA transmission limit System with pump stations rehabilitated, inflatable dams in place (2008) Potomac @ 460 mgd Calculate: • Wet & Dry Weather Flow generated by • Suburbs/DC • Treated volumes & CSO Suburban Flows Routed Around D.C. (C3-5) With out Suburbs No suburban flow BPWWTP derated to DC share Potomac PS @ 460 mgd Potomac PS @ DC share = 228.8 mgd DC Storage Suburban WWTP: 2.0/1.38 x DWF
Suburban calculation methods: Wet Wet Weather Flow (>511 mgd) Area 1 - Flow receiving full treatment in the first 4 hours, when plant capacity is 740 mgd Area 2 - Flow receiving full treatment after the first 4 hours, when plant capacity is 511 mgd Area 3 - Flow sent to excess flow treatment (336 mgd, or a total of 1,076 then 847 mgd) Dry Weather Flow Area 4 – flow <511 mgd Suburbs calculated volumes for 1 event & requested that volumes be calculated for entire 3 years Calculations Requested by Suburbs: Blue Plains Treatment Volumes
Calculations Requested by Suburbs: Blue Plains Treatment Volumes Calcs performed by Suburbs based on 1 storm 3-Year Runs (1) Model does not run between storm events. This dry weather volume is that which occurs immediately before and after storm events 7
Suburban flow peaks exceed treatment allocations (>2.0/1.38 x annual average) Suburbs contribute to excess flow Suburbs contribute to CSOs Suburbs get SSO relief connected to CSO system Governed by CSO Policy where overflows are allowed in average year, not SSO Policy where no overflows are allowed ever It’s less expensive for DC and suburbs to be in the system together than to be apart D.C. uses suburbs treatment capacity during CSO events and tunnel dewatering Suburbs use D.C. treatment capacity after D.C. storm surge passes due to lag System is shared, timing of flows works to benefit of all Separate systems for D.C. and suburbs would be larger and more expensive Technical Findings