Download
1 / 11
110 likes | 115 Views
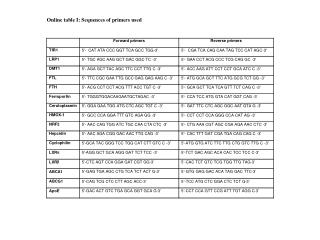
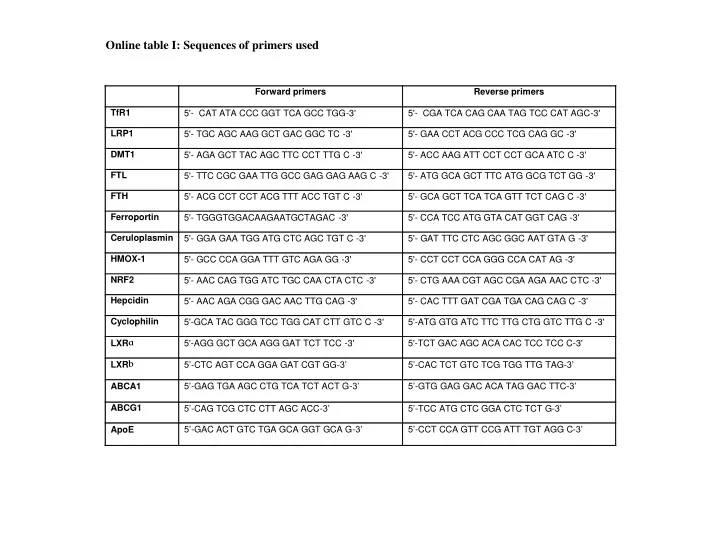
Forward primers. Reverse primers. TfR1. 5'. -. CAT ATA CCC GGT TCA GCC TGG. -. 3'. 5'. -. CGA TCA CAG CAA TAG TCC CAT AGC. -. 3'. LRP1. 5'. -. TGC AGC AAG GCT GAC GGC TC. -. 3'. 5'. -. GAA CCT ACG CCC TCG CAG GC. -. 3'. DMT1. 5'. -. AGA GCT TAC AGC TTC CCT TTG C.

E N D
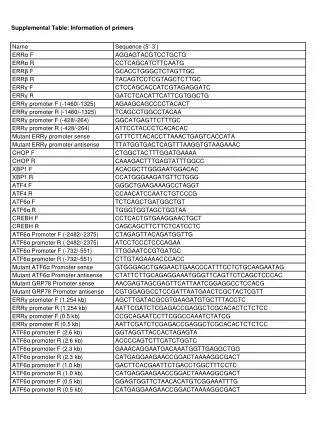
Forward primers Reverse primers TfR1 5' - CAT ATA CCC GGT TCA GCC TGG - 3' 5' - CGA TCA CAG CAA TAG TCC CAT AGC - 3' LRP1 5' - TGC AGC AAG GCT GAC GGC TC - 3' 5' - GAA CCT ACG CCC TCG CAG GC - 3' DMT1 5' - AGA GCT TAC AGC TTC CCT TTG C - 3' 5' - ACC AAG ATT CCT C CT GCA ATC C - 3' FTL 5' - TTC CGC GAA TTG GCC GAG GAG AAG C - 3' 5' - ATG GCA GCT TTC ATG GCG TCT GG - 3' FTH 5' - ACG CCT CCT ACG TTT ACC TGT C - 3' 5' - GCA GCT TCA TCA GTT TCT CAG C - 3' Ferroportin 5' - TGGGTGGACAAGAATGCTAGAC - 3' 5' - CCA TCC ATG GTA CAT GGT CAG - 3' Ceruloplasmin 5' - GGA GAA TGG ATG CTC AGC TGT C - 3' 5' - GAT TTC CTC AGC GGC AAT GTA G - 3' HMOX - 1 5' - GCC CCA GGA TTT GTC AGA GG - 3' 5' - CCT CCT CCA GGG CCA CAT AG - 3' NRF2 5' - AAC CAG TGG ATC TGC CAA CTA CTC - 3' 5' - CTG AAA CGT AGC CGA AGA AAC C TC - 3' Hepcidin 5' - AAC AGA CGG GAC AAC TTG CAG - 3' 5' - CAC TTT GAT CGA TGA CAG CAG C - 3' Cyclophilin 5' - GCA TAC GGG TCC TGG CAT CTT GTC C - 3' 5' - ATG GTG ATC TTC TTG CTG GTC TTG C - 3' a LXR 5' - AGG GCT GCA AGG GAT TCT TCC - 3' 5' - TCT GAC AGC ACA CAC TCC TCC C - 3' b LXR 5’ - CTC AGT CCA GGA GAT CGT GG - 3’ 5’ - CAC TCT GTC TCG TGG TTG TAG - 3’ 5’ - GAG TGA AGC CTG TCA TCT ACT G - 3’ 5’ - GTG GAG GAC ACA TAG GAC TTC - 3’ ABCA1 ABCG1 5’ - CAG TCG CTC CTT AGC ACC - 3’ 5’ - TCC ATG CTC GGA CTC TCT G - 3’ 5’ - GAC ACT GTC TGA GCA GGT GCA G - 3’ 5’ - CCT CCA GTT CCG ATT TGT AGG C - 3’ ApoE Online table I: Sequences of primers used
*** *** *** *** ** 2 A B C D 3 3 1.2 1.8 2.5 1.6 1 2.5 1.4 2 * 2 0.8 1.2 TfR1 / Cyclophilin DMT1 / Cyclophilin LRP1 / Cyclophilin FTH / Cyclophilin 1 1.5 1.5 0.6 0.8 1 1 0.4 0.6 0.4 0.5 0.5 0.2 0.2 E F G H 3 7 1.2 1.2 *** ** 6 2.5 1 1.0 5 2 0.8 0.8 4 FTL / Cyclophilin Ferroportin / Cyclophilin Ceruloplasmin / Cyclophilin Hepcidin / Cyclophilin 1.5 0.6 0.6 3 1 0.4 0.4 2 0.2 0.5 0.2 1 RM M2 RM M2 RM M2 RM M2 I L M Control Iron Control Iron ## RM 300 *** M2 250 RM RM ## 200 *** Iron content (nmol/mg protein) 150 §§§ 100 §§ M2 M2 §§ ** 50 Iron Online figure I. M2 macrophages load more iron than RM macrophages. Q-PCR analysis of TfR1 (A), LRP1 (B), DMT1 (C), FTH (D), FTL (E), ferroportin (F), ceruloplasmin (G) and hepcidin (H) in RM and M2 macrophages. mRNA levels were normalized to cyclophilin mRNA and results expressed as mean ± SD of triplicate determination relative to the levels in RM set at 1 (t test; *P<0.05, **P<0.01, ***P<0.001). RM and M2 macrophages were treated with iron (FeCl3 100µmol/L) during 24h. Statistical significant differences are indicated (t test; M2 control vs M2 iron **P<0.01, ***P<0.001; RM control vs RM iron §§P<0.01, §§§P<0.001; M2 iron vs RM iron ## P<0.01). Perls staining (I), ferrozine assay (L) and ferritin immunostaining (M) were performed.
* *** ** *** A B 25 1.2 *** 1 20 0.8 15 Hepcidin / Cyclophilin Ferroportin / Cyclophilin 0.6 10 *** 0.4 5 0.2 Cont 4h 8h 16h 24h Cont 4h 8h 16h 24h Online figure II.Iron loading regulates ferroportin and hepcidin gene expression in M2 macrophages. Q-PCR analysis of ferroportin (A) and hepcidin (B) in M2 macrophages incubated in the absence or presence of iron (FeCl3 50 µmol/L) for different time periods. mRNA levels were normalized to cyclophilin mRNA and results expressed as mean ± SD of triplicate determination relative to the levels in control cells set at 1 (t test; *P<0.05, **P<0.01, ***P<0.001).
A B C D * 2 3.5 2 2 ** ### ** §§ 1.8 ## 1.8 3 § 1.6 1.6 1.5 2.5 1.4 1.4 *** FTL / Cyclophilin 1.2 1.2 DMT1 / Cyclophilin 2 LRP1 / Cyclophilin TfR1 / Cyclophilin *** 1 1 1 ## 1.5 §§ 0.8 0.8 0.6 0.6 1 *** 0.5 ### 0.4 0.4 §§§ 0.5 0.2 0.2 RBC Control RBC Control RBC Control RBC Control RM M2 E F G H ### 1.6 ### ** 4 25 2.5 *** §§§ § 1.4 3.5 * 2 20 1.2 3 1 2.5 1.5 15 NRF2 / Cyclophilin ### Ferroportin / Cyclophilin *** 0.8 2 §§§ Hepcidin / Cyclophilin HMOX1 / Cyclophilin ### 1 10 0.6 1.5 §§§ 0.4 1 ** 0.5 5 *** 0.2 * 0.5 RBC Control RBC Control Control RBC RBC Control Online figure III. Erythrophagocytosis regulates the expression of genes related to iron metabolism mainly in M2 macrophages RM and M2 macrophages were loaded or not with senescent erythrocytes. TfR1 (A), LRP1 (B), DMT1 (C), FTL (D), hepcidin (E), ferroportin (F), HMOX-1 (G) and NRF2 (H) mRNA levels were measured by Q-PCR and normalized to cyclophilin mRNA and results expressed as mean ± SD of triplicate determination relative to the levels in RM without erythrocytes set at 1. Statistical significant differences are indicated (t test; RM control vs RM RBC or M2 control *P<0.05, **P<0.01, ***P<0.001; M2 control vs M2 RBC §P<0.05, §§P<0.01, §§§P<0.001, RM RBC vs M2 RBC ##P<0.01, ###P<0.001).
A B C D *** ** ** *** ** 3.5 2.5 1.8 1.6 § * §§§ §§ §§§ *** 1.6 1.4 3.0 # # # ## *** 2.0 ** §§ 1.4 * *** 1.2 2.5 *** *** * 1.2 ** 1.0 1.5 2.0 §§§ 1.0 ** LRP1 / Cyclophilin * § 0.8 FTL / Cyclophilin TfR1 / Cyclophilin ** DMT1 / Cyclophilin * 0.8 1.5 * *** ** # 1.0 # 0.6 *** *** *** 0.6 *** *** *** 1.0 §§§ 0.4 *** 0.4 0.5 0.5 0.2 0.2 Iron Iron Iron Iron RM M1 M2 E F G H * ** *** * 16 §§§ 3 9 §§§ 4.5 *** §§§ *** ** ** *** §§§ *** 8 14 4 ** 2.5 ## §§§ §§§ §§ 7 3.5 12 *** * *** §§ # 2 6 3 * 10 *** §§§ * ## ** ### *** 5 2.5 *** Ferroportin / Cyclophilin Hepcidin / Cyclophilin HMOX-1 / Cyclophilin *** 8 1.5 *** 4 NRF2 / Cyclophilin 2 §§§ § *** 6 *** ** *** 1.5 3 # 1 # *** # § 4 ** ## ** ** 1 2 *** *** ** * 0.5 2 0.5 §§ # 1 Iron Iron Iron Iron Online figure IV. Iron loading regulates the expression of genes related to iron metabolism mainly in M2 macrophages RM, M1 and M2 macrophages were loaded or not with increasing iron concentrations (FeCl3 25, 50, 100 µmol/L). TfR1 (A), LRP1 (B), DMT1 (C), FTL (D), hepcidin (E), ferroportin (F) HMOX-1 (G) and NRF2 (H) mRNA levels were measured by Q-PCR and normalized to cyclophilin mRNA and results expressed as mean ± SD of triplicate determination relative to the levels in RM without iron set at 1. Statistical significant differences are indicated (t test; RM, M1, M2 control vs RM, M1, M2 iron; *P<0.05, **P<0.01, ***P<0.001; RM vs M2 §P<0.05, §§P<0.01, §§§P<0.001; RM vs M1 #P<0.05, ##P<0.01, ###P<0.001).
* A B C * 20 45 2.5 * 18 40 16 2 35 14 30 12 1.5 Ferroportin / Cyclophilin (Fold over CD68+MR- set at 1) 25 NRF2 / Cyclophilin (Fold over CD68+ MR- set at 1) Hepcidin / Cyclophilin (Fold over CD68+MR- set at 1) 10 20 8 1 15 6 10 4 0.5 5 2 CD68+MR+ CD68+MR+ CD68+MR+ Online figure V. Genes of iron metabolism are high expressed in iron-containing CD68+MR+ alternative macrophages in human atheroscleroticplaques. Q-PCR analysis of NRF2 (A), hepcidin (B) and ferroportin (C) were performed on RNA from LCM-isolated CD68+MR- and CD68+MR+ macrophage-rich areas. mRNA levels were normalized to cyclophilin mRNA and expressed relative to the levels in CD68+MR- macrophage rich-areas set at 1. Each point corresponds to a single atherosclerotic plaque. The median value is shown (t test; *P<0.05).
70 RM ### *** M2 60 50 40 Cell medium iron concentration (nmoles) ### ** §§ 30 ### * ### §§ 20 10 8h 4h 6h 24h Online figure VI. Iron-loaded M2 macrophages display higher iron export capacity. RM and M2 macrophages were iron-loaded (FeCl3 100µmol/L, 24h) followed by different wash-out periods (4, 6, 8 and 24h). Medium iron content was measured by ferrozine assay as described and expressed as nmoles of released iron. Statistical significant differences are indicated (t test; M2 vs M2 4h *P<0.05, **P<0.01, ***P<0.001; RM vs RM 4h §§P<0.01; RM vs M2 ### P<0.001 ).
A B Cont Cont Cont Cont Iron Iron Iron Iron Cont Cont Cont Cont Iron Iron Iron Iron Scrambled Scrambled Scrambled Scrambled SiRNA LXRb SiRNA LXRb SiRNA LXRb SiRNA LXRb 1.5 4 §§ 3.5 *** 3 1 2.5 2 ABCA1 / Cyclophilin LXR β / Cyclophilin ### *** 1.5 0.5 1 0.5 D C ** ** 5 3 §§ §§ 4 2 3 ABCG1 / Cyclophilin ApoE / Cyclophilin 2 1 1 Online figure VII. LXRb activation is not affected by iron loading in M2 macrophages.M2 macrophages were transfected with scrambled or LXRb siRNA, in the presence or in the absence of iron (FeCl3 100 µmol/L, 24h) and Q-PCR analysis of LXRb (A), ABCA1 (B), ApoE (C) and ABCG1 (D) performed. mRNA levels were normalized to cyclophilin mRNA and results expressed as mean ± SD of triplicate determination relative to the levels in scrambled siRNA transfected cells set at 1. Statistical significant differences are indicated (t test; scramble vs scramble iron or siLXRβ control **P<0.01, ***P<0.001; siLXRβ control vs siLXRβ iron §§P<0.01; scramble iron vs Si LXRβ iron; ###P<0.001 ).
B 3 * 2.5 2 NRF2 / Cyclophilin 1.5 1 0.5 Control T09 C A 1.2 2.5 ** 1 2 0.8 Hepcidin / Cyclophilin * 1.5 Ferroportin / Cyclophilin 0.6 1 0.4 0.5 0.2 Control T09 Control T09 D E F 3 2.5 1.2 ** 2.5 ** 1 2 2 0.8 1.5 1.5 0.6 NRF2 / Cyclophilin Ferroportin / Cyclophilin ** Hepcidin / Cyclophilin 1 1 0.4 0.5 0.5 0.2 Control GW3965 Control GW3965 Control GW3965 Online figure VIII. LXR activation regulates gene expression in iron-loaded M2 macrophages. Q-PCR analysis of ferroportin (A,D), NRF2 (B,E) and hepcidin (D,F) mRNA in iron-loaded (FeCl3 100 µmol/L, 24h) M2 macrophages treated or not with T090317 (T09, 1µmol/L) or GW3965 (1µmol/L). mRNA levels were normalized to cyclophilin mRNA and results expressed as mean ± SD of triplicate determination relative to the levels in untreated M2 macrophages set at 1. Statistically significant differences are indicated (t test; *P<0.05, **P<0.01).
A B 1.4 1.2 1.2 1 1 0.8 Ferroportin / Cyclophilin Hepcidin / Cyclophilin 0.8 0.6 0.6 0.4 0.4 0.2 0.2 Scrambled SiRNA LXRb Scrambled SiRNA LXRb Online figure IX. Iron regulates gene expression is not an LXRb-mediated mechanism. Iron-loaded M2 macrophages were transfected with scrambled or LXRb siRNA. Q-PCR analysis of ferroportin (A) and hepcidin (B) was performed. mRNA levels were normalized to cyclophilin mRNA and results expressed as mean ± SD of triplicate determination relative to the levels in scrambled siRNA transfected cells set at 1.
Iron LXRa NRF2 ABCA1 ABCG1 Hepcidin Ferroportin Cholesterol efflux Iron release Online figure X. LXRa regulates iron export in M2 macrophages. Iron-induced expression of the cholesterol transporters ABCA1/ABCG1 is mediated, at least partially, by LXRa. In addition, LXRa activation reduces the expression of hepcidin and increases the expression of NRF2, resulting in an increased ferroportin expression thus leading to an enhanced iron release. These data indicate that some of the physiological effects of iron can occur through the activation of the LXRa pathways.