Download
1 / 37
370 likes | 613 Views
Macro-invertebrate Analysis. Indications of Ecological Change. Macro-Invertebrates. Macro Means ‘large’, or ‘can be seen by the naked eye’ Whose eyes? Through a magnifying glass? What are the boundaries here? Invertebrate Vertebrate means ‘with backbone’

E N D
Macro-invertebrate Analysis Indications of Ecological Change
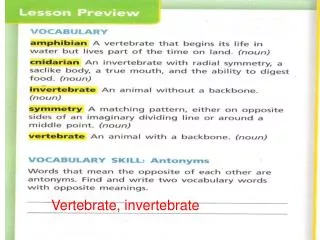
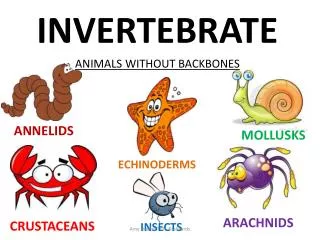
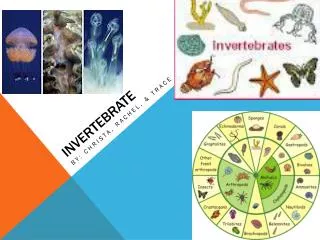
Macro-Invertebrates • Macro • Means ‘large’, or ‘can be seen by the naked eye’ • Whose eyes? • Through a magnifying glass? • What are the boundaries here? • Invertebrate • Vertebrate means ‘with backbone’ • Invertebrate simply means ‘without backbone’
Macro-Invertebrates • So, macro-invertebrates are simply small animals that have no backbone and can generally be seen with the naked eye. • BUT, due to the need to analyse for some ecologically important ‘meso-scopic’ species, this definition can include ‘magnifiable’ species.
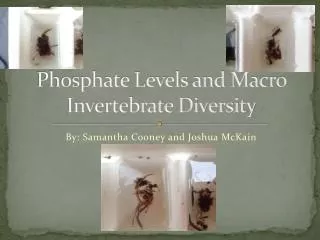
Macro-Invertebrates (MI) Analysis • MI analysis started in earnest in Australia in 1993, with a defining study performed on the Hawkesbury River catchment’s. • Since then, it has fast become a integral part of the planning side of the environment, but not so much on the protection side.
The general concept • For the most part of this course, you will analyse chemicals in the environment. • We will look for chemicals that we don’t expect (or want) in our environment, which we call pollution. • So what!
The general concept • If we compare the list of chemicals that we do expect to a list of chemicals that we don’t expect, we can say whether or not a site is ‘polluted’ • But what does this actually mean! • How do we know the effects of that pollution will be good, bad or indifferent?
The general concept • WE DON’T! • So scientists decided to set up a series of things called… ‘Rapid Bio-assessment Procedures’
The general concept • RBP are many and varied. • Most are very specific. • One general one that has taken on universal and worldwide appeal is the macro-invertebrate analysis • But what do they tell us?
The general concept • The MI RBP has the potential to tell us whether human activities are altering the ecology of a site. • Class Discussion • Why would this be better that just a list of pollutant concentrations?
How are MI RBP used in Australia? • Mainly for Environmental Planning. • State of Environment Reports (federal & state) • Urban planning • Natural resource management • Research • But also for Environmental Protection. • Some EPA licenses require them • Some mining and agriculture require them
Why do you need to know it? • Fast becoming the realm of the Environmental Technician. • Should soon be standard methods, as opposed to mass confusion. • Relates chemical pollution and environmental impact via ecology.
The overall picture • Before we look at what WE do, lets talk about how it can be done in general.
The overall picture • A MI analysis can be broken down into the following parts. • Planning the events(s) • Collecting / preserving bugs • Sorting / identifying the bugs • Calculating ‘scores’ • Monitoring scores over time • Interpreting results (individual and time based)
Planning a bug survey • Identify the objectives • Define the survey site (boundaries) • Identify the specific sites • Decide on the exact methods for sites • Choose sorting and ID procedures • Choosing the scoring method • Identifying timeframes
Collecting the bugs • Although there are many ways species can be collected, the methods will always involve three things; • A person • A dip net • Time
Sorting & Identifying Bugs • A painful process? Hmm.. It shouldn’t be! • We need to define the following aspects; • Do we identify to a class, order, family, genus or species level? • Exactly what do we identify? Every organism within a level, or do we define the exact list of organisms we ID?
Calculating Scores • What scoring method should we employ for our study? • Unfortunately, there are hundreds of these ‘indices’ to choose from. • More on this later…
Monitoring over time • This is the easy part.. • Take the data, plot it on a graph, stand back and admire the pretty patterns! • But what does it all mean? • There is no point in analysing something if you cannot interpret the results!
Interpreting Results • If you think that planning, collecting, sorting, identifying and monitoring the MI’s was difficult/tedious/painful and fraught with error and contradiction… …try figuring out what all the data means! Luckily (for all of us) this is done by boffins
So what do we do? • The planning was done long ago but involved both TAFE and LMCC • The analysis is done mainly for the tip site, in order to assess the impact of the tips activities on the local environment. • There is currently no information on whether it is or isn’t. • The other sites are performed for similar reasons, such as the industrial activities near group 3, residential activities near group 1, and sewage near group 2!
The details of MI analysis • There are 5 simple questions; • Why do we sample? • How do we sample? • What do we sample? • Where do we sample? • When do we sample? • Finally, we need to compare what we do with what we should do!
Why do we sample? • As mentioned, we sample for LMCC • But are the objectives for education, research, planning, protection, what?? • The Toronto survey is for the purposes of providing data for impact assessment. • Obviously your education fits in here somewhere
How do we sample? • We use ~15 cm dip nets • We sample for 1 ‘person hour’ – which can be broken down into 2 people for ½ hour intervals, or any other such fraction. • We aim to collect 100 bugs in total, with no more than 20 of one species being collected. • We wave our dip nets around in the water aimlessly hoping that bugs just crawl into them and surrender.
What do we sample? • We sample anything that crawls into the nets! But we shouldn’t! • We provide a finite list of organisms (and pretty pictures) so that we can define our range of targeted species. • This (should) avoid inevitable confusion
Where do we sample? • We sample predetermined sites based on ease of access, time, safety, cost and equipment considerations. • In other words, we sample where bugs don’t live, like rock shelves, and ephemeral creek beds and the like!
When do we sample? • We sample approximately every month, excluding the major holiday period. • We sample between the hours of 9:30 and 12:00 midday
What should we be doing? • Hmmm… an interesting question! • Obviously, the way we do things is heavily constrained by many things, but in essence, everything we do is correct!
The Correct MI Methods • Firstly – references… • US EPA Benthic MI Protocols • Waterwatch Australian National Technical Manual (Module 3) • SIGNAL 2.iv User Manual • These three references will keep anyone out of trouble for a while! • All of these materials are available on the WWW, and in our office.
The Correct MI Methods • If both pelagic and benthic MI are being targeted, then proper equipment is needed for both environments. • Kick nets are used for benthic surveys • 30 cm D-Frame nets are used for pelagic
The Correct MI Methods • Times and number of bugs surveyed vary depending on the scoring method you use • The location should be based on where animals are likely to live, and so that a variety of different habitats are sampled • Different bugs live in different areas and behave in different ways!
The Correct MI Methods • Where can bugs live? • In soft sediments/soils etc, such as worms or molluscs • On bottom substrates, such as snails etc • Pelagic • Can it live anywhere?
The Correct MI Methods • How do bugs live? • Breeding habits and cycles • What time of year • Larval and pupa stages etc • Lifespan • Active hours • Nocturnal???
The Correct MI Methods • How do bugs eat? • Herbivores or carnivores • Grazers • Scrapers • Filters • Predator-prey interactions
The Correct MI Methods • Sites should be chosen based on the above criteria. • The reach of a site is important. Sampling should be performed on a 10 m reach of a creek edge • Wetlands are generally exclude from these activities.
The Correct MI Methods • There are 5 habitats identified by the US EPA as critical; • Cobble, aka riffles (which is like gravel) • Snags (such as submerged logs) • Vegetated banks • Submerged macrophytes (plants) • Sands (and other fine sedimets) • All should be sought after and sampled!
The Correct MI Methods • Sampling should start downstream and work upstream. • Refer to the Waterwatch manual for all other details.
What about the calculations? • The SIGNAL Index • Stands for ‘Stream Invertebrate Grade Number – Average level’ • But what is an Index anyway? • An index or indices are literally number tricks • Allow a unitless yet meaningful number to be generated which can be interpreted as good or bad! • There are hundreds of variants.