Download
1 / 13
130 likes | 193 Views
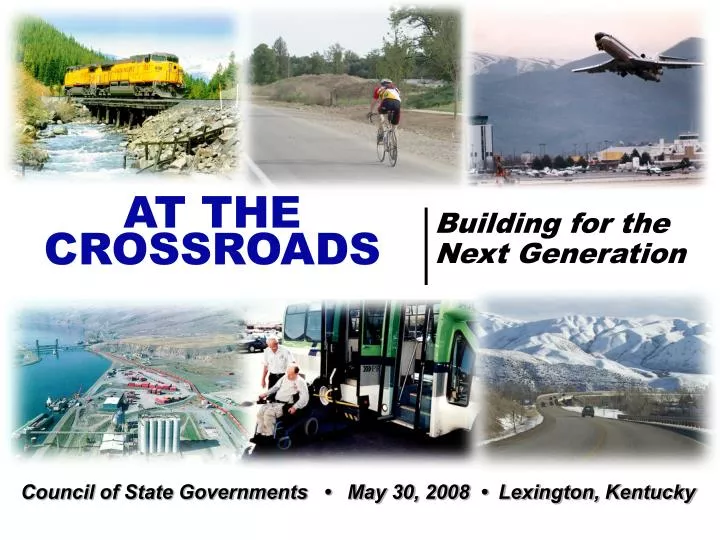
AT THE CROSSROADS. Building for the Next Generation. Council of State Governments • May 30, 2008 • Lexington, Kentucky. System Features 58,000 state-maintained miles (125,600 lane miles) Approx. 11,000 additional miles maintained by localities 20,000+ bridges/culverts

E N D
AT THE CROSSROADS Building for the Next Generation Council of State Governments • May 30, 2008 • Lexington, Kentucky
System Features 58,000 state-maintained miles (125,600 lane miles) Approx. 11,000 additional miles maintained by localities 20,000+ bridges/culverts 6 tunnels 3 toll facilities 4 ferry services 41 safety rest areas and 10 welcome centers 107 commuter parking lots 212 million vehicles miles traveled annually 8,800 employees (approx.) Revenue and Spending Funding Sources: Federal Sources ($1.159 billion) State Motor Fuel Tax ($844 million) State Motor Vehicle Sales & Use Tax ($575 million) State Motor Vehicle Licenses ($166 million) .5% of the State General Sales & Use Tax ($407 million) Other Revenue Sources ($639 million) FY07 Budget—$3.8 billion $1.5 billion maintenance $1.2 billion for operations, debt service, payments to agencies, administration $1.1 billion system construction FAST FACTS FAST FACTS
THE LANDSCAPE Transportation Trends • Freight volumes growing faster than passenger • Community and land-use impact • Globalization • Increasing congestion • Changing demographics • Energy and the environment • System operations and safety • Institutional change • Funding/national vision Business Environment • Long-term financial uncertainty • Increasing maintenance costs • Declining construction program • Aging infrastructure • “Graying” employee pool • Emergency response in critical situations/disasters • Need to maintain strong engineering, technology and management expertise
Increasing congestionVehicle travel up 78%; road miles increased 1% and lane miles 2% in last 20 years
What Customers Want: • Multimodal systems that provide choices • Quality of life that respects history and protects its environment • Being engaged in making decisions about the system • Achieving goals within the bounds of reasonable funding
21ST CENTURY • Mobility (outcomes) • Customer-oriented • System-focused • 24x7 • Proactive • Performance-driven • Partnerships THE BUSINESS ENVIRONMENT 20TH CENTURY • Public works • Project-focused • Our jurisdiction • 8 a.m. – 5 p.m. • Reactive • Business as usual • Do it our way
The Vision System Performance System Health State System Planning Corridor and Area Plans Customer Expectations THE CHALLENGE
THE BUSINESS FUTURE • International in Scope • Intermodal / Integrated in Form • Intelligent in Character • Inclusive in Service
FOCUS ON: • … the SYSTEM • Safety • OpERations • Shape/Size/Ownership • …the WORKFORCE • Size • Shape • Training/Education Dashboard 3.0 RIGHT FOCUS Getting Customers there safely and reliably Giving Customers Choices Delivering on on-time, on-budget, with high quality RIGHT SIZE Employing the Right Skills Working Smarter Being Flexible/Accountable • … the BUSINESS • Business Practices • Project Development System • Organization Future RIGHT BUSINESS APPROACH Embracing high-value Technology Privatizing where we can Retaining Public Responsibility where we should
Dashboard 3.0 • Crashes • Deaths from Crashes • Injuries from Crashes • Work Zone Crashes • Pavement Condition • Bridge Condition • Ride Quality • Planned vs. Actual Expense • Purchase Power Forecast vs. Actual Revenue Trends • System Level of Service • HOV Performance • Incident Duration • Travel Time on Key Commuter Routes Governor’s Management Scorecard: • Human Resource Management • Government Procurement • Financial Management • IT/Enterprise Architecture Initiatives • Performance Management • Environmental and Historic Resource Stewardship Customer Satisfaction Survey • Overall Satisfaction • Overall Roadway Maintenance • Pavement Smoothness – Ride Quality • Signs and Markings • Travel and Congestion Information • Rest Areas and Welcome Centers • Litter Removal • Emergency Response • Roadside Appearance • Communication with the Public • Studies (% Green Status) • Projects advertised on-time • Cost Estimates (% Green Status) • Design Quality (under development) • Projects completed on-time • Projects completed on-budget • Environmental Compliance (bold items are Key Measures)
THANK YOU Leaders are called to stand In that lonely place Between the no longer and the not yet And intentionally make decisions That will bind, forge, move And create history. We are not called to be popular, We are not called to be safe, We are not called to follow. We are the ones called to take risks, We are the ones called to change attitudes; To risk displeasures, We are the ones called to gamble our lives For a better world. House of Delegates Address By Mary Lou Anderson April 1970