Download
1 / 23
230 likes | 330 Views
Graduate returns, HE expansion and ability composition Based on joint work with Jeremy Smith and Shqiponja Telhaj Motivation Policy (HE Fees regimes: Dearing, Browne ) Variation by gender, subject, university, background, cohort, cohort characteristics (age-participation index, API)

E N D
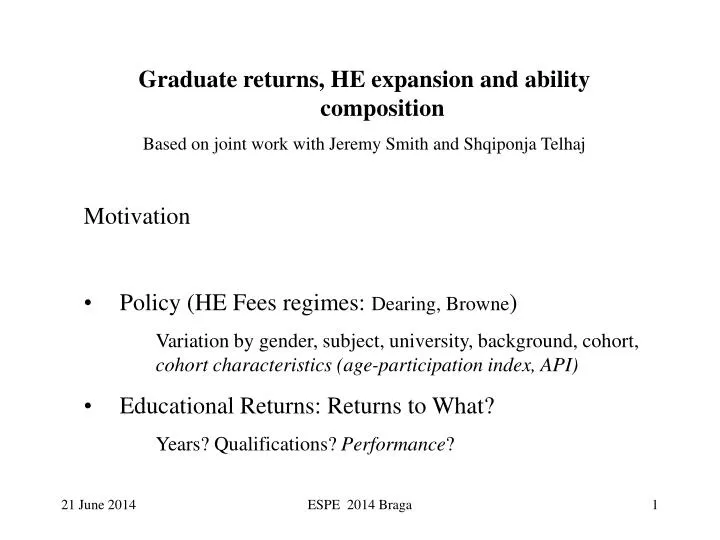
Graduate returns, HE expansion and ability composition • Based on joint work with Jeremy Smith and Shqiponja Telhaj • Motivation • Policy (HE Fees regimes: Dearing, Browne) • Variation by gender, subject, university, background, cohort, cohort characteristics (age-participation index, API) • Educational Returns: Returns to What? • Years? Qualifications? Performance? ESPE 2014 Braga
Educational Returns: Returns to What? Years? Qualifications? Performance? Variation by performance measure: If HKT: econometrician suffers info’ asymmetry estimates of performance premium suffer ability bias extent of bias likely to vary with API If Signalling: employer suffers info’ asymmetry return to education is a return to signalled ability (short-lived under EL-SD) return is likely to vary with API ESPE 2014 Braga
Educational Returns: Returns to What? • Years? Qualifications? Performance? • Prospective students are interested in variation by performance measure: • Bigger Variation => greater risk • If HKT: individuals uncertain of their capacity to acquire HK • If Signalling: individuals uncertain about ability & signals might have long-term effects (contrary to EL-SD) ESPE 2014 Braga
Ability composition and returns to ability Assume: ESPE 2014 Braga
Ability Composition The US college wage premium: theory and evidence And also Hendricks and Schoellman (2013). ESPE 2014 Braga
Ability Composition: Graduate returns in the UK What happens if HE API grows? There is no change in . But this is a special result under the uniform distribution . Blackburn and Neumark show that under a triangular distribution, falls . ESPE 2014 Braga
What happens to and hence the ‘performance premium’ with an increase in the API? Even under the uniform distribution, the performance premium will increase as the ability gap is stretched… ESPE 2014 Braga
0.07 f(a) 1 L H O A 50 36 8 6 a 0.97 0.68 0.90 0.25 0 1 Ability distribution across broad educational groups; 1985 characterisation. ESPE 2014 Braga
Let’s now turn to the evidence. • What is the evidence on returns to degrees in the UK? (BCS70 relative to NCDS 1958) • Is there a substantial ‘performance premium’ among graduates? (High vs Low degree class) • Has any such premium changed over time in the way consistent with ‘composition-induced changes in ability bias’? ESPE 2014 Braga
Results 1: UK evidence on returns to a degree (1970 birth cohort) HE API HE API (%) +4 cohorts1 Men Women NCDS 14% 14% 12-18 34-38 1958 (1977) Birth cohort (17%,11%) (men, women) BCS70 1970 (1989) Birth cohort (19%,17%) (men, women) 1Eg, entering HE in 1993, graduating in 1996, 4yrs experience by 2000 when £ observed of 1970 birth cohort. 18% 30% 15 18 ESPE 2014 Braga
Results 2: UK evidence on returns by degree class Note RDD approach of Feng and Gaetz, LSE 2013: Implied estimate of ca. 8% for ‘good’ over ‘lower’ degree (Is that high or low…?) Consider relative to College Wage Premium: BCS70 and LFS… Mean (2-digit) SIC earnings, DLHE (6 months), 4 cohorts, ca500 students per cohort, 2005-10, matriculating 2002-07 (API stable at ca3 5% - similar to API for our 1998 HESA cohort). ESPE 2014 Braga
Results 2: UK evidence on returns by degree class (‘1970’ birth cohort) - Estimated log wage premia (BCS70) Notes: p-values in parentheses. Ability controls include: BAS (verbal), BAS (numerical). Background controls include: parental income, parental social class, mother’s interest in education, father’s interest in education, mother’s education, father’s education. Other controls include: region (aged 10), gender, marital status and number of children, ethnicity. ESPE 2014 Braga
Results 2: UK evidence on returns by degree class (‘1970’ birth cohort) - Estimated log wage premia (LFS: 1969-71 births) Notes: p-values in parentheses. Wages observed between 2005Q1 and 2012Q4 and have been deflated by the average earnings index. Other controls include: gender, marital status and number of children, ethnicity and tenure with current employer. ESPE 2014 Braga
Results 2: UK evidence on returns by degree class BCS70 and LFS have cell size limitations… …so consider full student populations and administrative data… ESPE 2014 Braga
Results 2: UK evidence on returns by degree class (‘1970’ birth cohort) - Estimated log earnings premia (USR91: 1969-71 births) Note: p-values in parentheses. Ability controls include: pre-University qualifications. Background controls include: social class of parents, school-type. Other controls include: gender, marital status, University attended and type of degree course. ESPE 2014 Braga
Results 2: UK evidence on returns by degree class • The USR administrative data has two limitations: • Graduate 4-digit occupations, rather than personal wages • Graduate destinations after only 1 year. • So consider Graduate Cohort Surveys… ESPE 2014 Braga
Results 2: UK evidence on returns by degree class (‘1970’ birth cohort) - Estimated log wage premia (GCS1990: 1968-70 births) Note: p-values in parentheses. Ability controls include pre-university qualifications, background controls include parental education, and other controls include age, gender, ethnicity, and marital status. ESPE 2014 Braga
Results 3: Evidence on Performance Premium across cohorts ESPE 2014 Braga
Results 3: UK evidence on returns by degree class (across cohorts) Estimated log-wage good degree class premia (LFS) – selected birth and age cohorts. See notes to Table 2 for controls included in these models. ESPE 2014 Braga
Results 3: UK evidence on returns by degree class (across cohorts) Estimated log-earnings premia (USR; HESA: selected cohorts) and by university type, graduates aged 21-23 ESPE 2014 Braga
Results 3: UK evidence on returns by degree class (across cohorts) - Estimated log-wage good degree class premia (GCS: 1985 and 1990) Notes: See notes to Table 4. ESPE 2014 Braga
5. Conclusions/limitations/further work (i) Some evidence that substantial increase in API of women has been associated with a fall in the college wage premium - but not correcting for selection into employment. (ii) Some evidence that degree class premium has increased over time with increase in API (iii) Need to analyse more recent HESA/DLHE/follow-up data. (iv) Need to complement large data results with ‘fine data’ analysis – eg RDD. ESPE 2014 Braga