Download
1 / 45
741 likes | 1.53k Views
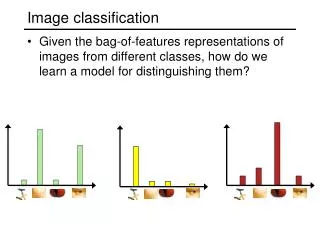
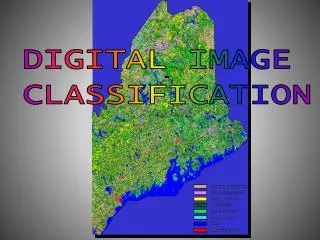
Image Classification. Image Classification. Automatically categorize all pixels in an image into land use/cover classes or themes. A process of thematic information extraction A process of pattern recognition. Image Classification.

E N D
Image Classification • Automatically categorize all pixels in an image into land use/cover classes or themes. • A process of thematic information extraction • A process of pattern recognition
Image Classification • The process of arranging raw data DNs into information classes. • Two Basic Types • Supervised • Unsupervised Data Information Raw Imagery Extracted Information
Supervised Classification • The image analyst “supervises’ the pixel categorization process specifying, to the computer algorithm, numerical descriptors of the various land cover types present in a scene. • Representative sample sites of known cover type, called training areas, are used to compile a numerical “interpretation key” that describes the spectral attributes for feature type of interest.
Unsupervised Classification In an unsupervised classification, the computer groups pixels with similar spectral characteristics into unique clusters according to some statistically determined criteria. The analyst then labels and combines the spectral clusters into information classes.
Land-use and Land-cover Classification Schemes Land cover refers to the type of material present on the landscape (e.g., water, sand, crops, forest, wetland). Land use refers to what people do on the land surface (e.g., agriculture, commerce, settlement).
Land-use and Land-cover Classification Schemes • A classification scheme contains taxonomically correct definitions of classes of information that are organized according to logical criteria. • The classes in the classification system should normally be: • mutually exclusive, • exhaustive, and • hierarchical.
Land-use and Land-cover Classification Schemes • Mutually exclusivemeans that there is no taxonomic overlap of any classes (i.e., deciduous forest and evergreen forest are distinct classes). • Exhaustive means that all land-cover classes present in the landscape are accounted for and none have been omitted. • *Hierarchical means that sublevel classes (e.g., single-family residential, multiple-family residential) may be hierarchically combined into a higher- level category (e.g., residential) that makes sense.
Land-use and Land-cover Classification Schemes It is also important for the analyst to realize that there is a fundamental difference between information classes and spectral classes. * Information classes are those that human beings define. * Spectral classes are those that are inherent in the remote sensor data and must be identified and then labeled by the analyst.
U.S. Geological Survey Land-Use/Land-Cover Classification System for Use with Remote Sensor Data
Feature Space Scatter plots • Compares two image bands in feature space • Basically two histograms displayed on two perpendicular axes. The brighter a particular point is in the display, the more pixels within the scene having that unique combination of band values.
Pixel Position (X,Y) 255 64, 191 191 191, 127 Band Y 127 64, 64 64 127 191 0 64 255 Band X
Scatterplot: High Correlation Image with 5 pixels 255 191 Band Y 127 64 127 191 0 64 255 Band X
Low Correlation Image with 5 pixels 255 191 Band Y 127 64 127 191 0 64 255 Band X
Well Defined Clusters Image with 30 pixels and 5 clusters 255 191 Band Y 127 64 127 191 0 64 255 Band X
Not So Well Defined Clusters Image with 30 pixels and 5 clusters 255 191 Band Y 127 64 127 191 0 64 255 Band X
Poorly Defined Clusters: Some Class Confusion 255 191 Band Y 127 64 127 191 0 64 255 Band X
Very Poorly Defined Clusters: Total Class Confusion 255 191 Band Y 127 64 127 191 0 64 255 Band X
Calculating Cluster Mean Mean for Red-Dots Cluster 10 7.5 X Mean: (2.5+2.5+5+ 5+10) / 5 = 5 Band Y 5 Y Mean: (2.5+ 2.5+ 5+10+10) / 5 = 6 Cluster Mean = 5,6 2.5 5 7.5 0 2.5 10
10 7.5 Band Y 5 2.5 0 5 7.5 10 2.5 Calculating Cluster Variance Cluster Mean For x = 5 Cluster Mean For y = 6 Variance(X) for Cluster = 7.5 Variance(Y) for Cluster = 8 For Var(x) = [(2.5 - 5)2 + (2.5 - 5)2 + (5 - 5)2 + (5 - 5)2 + (10 - 5)2 ]/5 = (6.25 + 6.25 + 0 + 0 + 25)/5 = 37.5 / 5 =7.5 For Var(y) = [(2.5 - 6)2 + (2.5 - 6)2 + (5 - 6)2 + (10 - 6)2 + (10 - 6)2] /5 =(3.5 + 3.5 + 1 + 16 + 16/5 = 40/5 = 8
Calculating Cluster Standard Deviation 1 Standard Deviation 10 7.5 Variance(X) for Cluster = 7.5 Variance(Y) for Cluster = 8 Band Y 5 2.5 0 5 7.5 10 2.5 Band X
Calculating Distance in 2d Space 100 75 Band Y 50 25 50 75 0 25 100 Band X
Parallelepiped View: Standard Deviation 255 191 Band Y 127 64 127 191 0 64 255 Band X
Class Ellipse View: Standard Deviation 255 191 Band Y 127 64 127 191 0 64 255 Band X
Parametric vs. Non-Parametric Signatures • A parametric signature is based on a statistical analysis of the pixels that are in the training site or a cluster. • A parametric decision rule uses statistical analysis to assign pixels in an image to a particular class. When a given pixel meets the parameters of the decision rule for a given class the pixel is assigned to that class. • A non-parametric signature is not based on statistics, but on discrete objects within feature space. • With a non-parametric decision rule, if a pixel is located within the boundary of the non-parametric signature in feature space then that pixel will be assigned to the category represented by the signature.
Parametric vs. Non-Parametric Signatures Parametric: Statistically Defined Non-Parametric: User Defined 255 255 TM 4 TM 4 0 0 255 255 TM 3 TM 3
User Defined Signature (Non-Parametric) 255 191 Band Y 127 64 127 191 0 64 255 Band X
Supervised Classification • Supervised: A method in which the analyst spatially defines training sites representative of each desired class (category). The analyst then "trains" the computer software to recognize varying spectral values in two or more spectral bands associated with those training sites. This is called signature definition. After signatures for each category have been defined, the computer then uses those signatures to classify the remaining pixels in the study area. Data Information Signature Creation Training Data Collection Raw Imagery Training Sites Extracted Information
Define Classification Scheme -Example: Land Use/Cover Classification Scheme, Atlanta Georgia Metropolitan Area. Classification of Landsat TM images.
Collect Training Data. • GPS Field Data • Refer to air photos • Visually selecting training sites on the original Landsat TM images using human intelligence Cotton Field
Create Training Areas • Create training areas for each category. • In ERDAS Imagine, we do this by define Area of Interest (AOI)
4. Create Signatures. A set of statistics that defines the multi-spectral characteristics of a target phenomenon or training site.
5. Choose Best Supervised Algorithm. • 1. Minimum Distance • 2. Parallelepiped • 3. Maximum Likelihood • with Null class • without Null class
Minimum Distance Classifier 255 • Every pixel is assigned to the a category based on its distance from cluster means. • Standard Deviation is not taken into account. • Disadvantages: generally produces poorer classification results than maximum likelihood classifiers. • Advantages: Useful when a quick examination of a classification result is required. 191 127 64 127 191 0 64 255
Parallelepiped 255 • Pixels inside of the rectangle (defined in standard deviations), are assigned the value of that class signature. • Pixels outside of the rectangle (defined by standard deviations) are assigned a value of zero (NULL). • Disadvantages: poor accuracy, and potential for a large number of pixels classified as NULL. • Advantages: A speedy algorithm useful for quick results. 191 127 64 127 191 0 64 255
Maximum Likelihood With Null Class • Pixels inside of a stated threshold (Standard Deviation Ellipsoid) are assigned the value of that class signature. • Pixels outside of a stated threshold (Standard Deviation Ellipsoid) are assigned a value of zero (NULL). • Disadvantages: Much slower than the minimum distance or parallelepiped classification algorithms. The potential for a large number of NULL. • Advantages: more “accurate” results (depending on the quality of ground truth, and whether or not the class has a normal distribution). 255 191 127 64 127 191 0 64 255
Maximum Likelihood Without Null Class 255 • Pixels inside of a stated threshold (Standard Deviation Ellipsoid) are assigned the value of that class signature. • Pixels outside of stated threshold (Standard Deviation Ellipsoid) are classified by minimum distance rules. • Disadvantages: Slow Algorithm • Advantages: High accuracy with no tied or null pixels. 191 127 64 127 191 0 64 255
Unsupervised Classification • Unsupervised: A method in which the computer separates the pixels in an image into classes (clusters) with no direction from the analyst. After the computer has completed the classifying operation the analyst determines the land-cover type for each class based on image interpretation, ground-truth information, maps, field reports.etc. , and assigns each class to a specified category (aggregation). Data Information Aggregation Classification Classified Image 80 Classes (Clusters) Raw Imagery (6 bands) 256 Grey Level Values Each Extracted Information 11 Categories
Steps in Unsupervised Classification • Define Classification Scheme • Configure and Run Classifier • Aggregate Classification • Label Classes • Check Accuracy
Unsupervised Classification • Unsupervised classification (commonly referred to as clustering) is an effective method of partitioning remote sensor image data in multispectral feature space and extracting land-cover information. • Compared to supervised classification, unsupervised classification normally requires only a minimal amount of initial input from the analyst. This is because clustering does not normally require training data.
Unsupervised Classification • Hundreds of clustering algorithms have been developed. • ERDAS Imagine uses clustering algorithm ISODATA • (Iterative Self-Organizing Data Analysis)