Download
1 / 51
510 likes | 603 Views
Evaluating Perceptual Cue Reliabilities. Robert Jacobs Department of Brain and Cognitive Sciences University of Rochester. Perception is Hard. Q: Why is perception so hard? A: Perceptual cues are ambiguous. Perception is Easy. Q: Why is perception so easy?

E N D
Evaluating Perceptual Cue Reliabilities Robert Jacobs Department of Brain and Cognitive Sciences University of Rochester
Perception is Hard • Q: Why is perception so hard? • A: Perceptual cues are ambiguous
Perception is Easy • Q: Why is perception so easy? • A: Perceptual world is highly redundant
Example: Visual Perception • Many cues to visual depth and shape: • object rotation (kinetic depth effect) • observer motion (motion parallax) • binocular vision (stereopsis) • shading gradients • texture gradients • linear perspective • atmospheric blur • etc.
Example: Visual Perception • However, no single cue: • is necessary for depth or shape perception • dominates our perception in all situations • is capable of supporting perception with the robustness and accuracy demonstrated by observers in natural settings
Perceptual Cue Combination • Need to study the use of multiple perceptual cues • Recent emphasis on studying how observers combine information from multiple perceptual cues • key issue: cue reliability
Two Views of Cue Reliability • How do people estimate cue reliabilities? • a cue is reliable if the distribution of inferences given that cue has a small variance • a cue is reliable if the inferences based on that cue are consistent with the inferences based on other cues
Collaborators • Integration of visual and auditory signals for spatial localization: • Peter Battaglia • Richard Aslin • Experience-dependent adaptation of visual cue combination strategies based on consistencies between visual and haptic percepts: • Joseph Atkins • Jozsef Fiser
Integration of Visual and Auditory Signals for Spatial Localization • Cue-consistent versus cue-conflict environments • Two models for cue-conflict situations: • Winner-take-all (Visual Capture) • Maximum Likelihood Estimation (MLE)
Maximum Likelihood Estimation • Statistically optimal cue combination rule (given certain mathematical assumptions) • Linear combination rule:
Maximum Likelihood Estimation • A highly reliable signal is one for which P(location | signal) has a small variance • A less reliable signal is one for which P(location | signal) has a large variance • Highly reliable cues are assigned a large weight • Less reliable cues are assigned a small weight
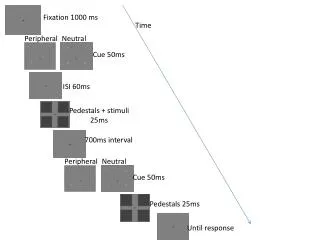
Procedure • Auditory-only trials • Estimate auditory mean and variance • Visual-only trials • Estimate visual mean and variance • Compute predictions of two models on visual-auditory trials: • Compute Visual Capture predictions • Compute MLE predictions • Visual-Auditory trials
Auditory Stimuli • Broadband noise filtered to mimic the spectral characteristics of a sound source external to the listener
Visual Stimuli • Random-dot stereogram of a bump protruding from a background surface • Noise could be added to visual stimulus • Low noise: easy to detect and localize bump • High noise: difficult to detect and localize bump
Subject EJA: Visual-Auditory Trials • Low visual noise: • PSE near location of visual stimulus • Visual weight near one; auditory weight near zero • High visual noise: • PSE at a location between visual and auditory stimuli • Visual and auditory weights each near one-half
Models • MLE partially correct • Signal reliability significantly altered judgments of spatial location • Visual Capture partially correct • Judgments are characterized by an overall bias to rely on visual over auditory information • Hybrid model may be best
Two Views of Cue Reliability • How do people estimate cue reliabilities? • a cue is reliable if the distribution of inferences given that cue has a small variance • a cue is reliable if the inferences based on that cue are consistent with the inferences based on other cues
Visual and Haptic Percepts • Example: Bishop George Berkeley (1709) Perception of depth results from associations between visual cues and sensations of touch and motor movement • “Touch educates vision” This idea has not been seriously evaluated: • difficult to experimentally test in a direct and detailed manner
Visual Stimuli • Horizontal cross-section of cylinder: • Circular: cylinder equally deep as wide • Elliptical: cylinder more deep than wide • Elliptical: cylinder less deep than wide • Visual cues to cylinder shape: • Texture cue: homogeneous and isotropic texture mapped to surface of each cylinder • Motion cue: texture elements move horizontally along the surface of a cylinder (constant flow field)
Cue Conflict in Visual Stimuli • Cue conflict: • Computer graphics manipulation to independently manipulate the shapes indicated by texture and motion cues (Young, Landy, and Maloney, 1993) • Example: • Texture cue: circular cylinder • Motion cue: elliptical cylinder that is more deep than wide
Visual Cue Combination Model • Linear model: = depth percept based on texture = depth percept based on motion = linear coefficient associated with texture = linear coefficient associated with motion Based on results of test trials, it is possible to estimate and
Procedure • On each training trial: • Subjects viewed a display of a cylinder • Subjects grasped the cylinder • Subjects judged whether the visual and haptic percepts of cylinder depth were the same or different • Auditory signal provided feedback as to whether the response was correct or incorrect
Procedure Texture relevant training trial: texture cue and haptic cue to cylinder depth were consistent (motion cue was uncorrelated) Motion relevant training trial: motion cue and haptic cue to cylinder depth were consistent (texture cue was uncorrelated)
Procedure • Visual test: • Subjects viewed two sequentially presented displays of cylinders • Subjects judged which of the two cylinders was greater in depth • Allowed us to estimate cue weights and
Procedure • Motor test: • Subjects viewed a cylinder • Subjects adjusted their thumb and index fingers to indicate the perceived cylinder depth • Allowed us to estimate cue weights and
Experiment 1 • Are there differences in observers’ cue combination rules after motion relevant training versus after texture relevant training? • Prediction: Linear coefficient is larger after motion relevant training than after texture relevant training
Visual test: 7 out of 7 subjects have larger motion weights after motion relevant training Motor test: 6 out of 7 subjects have larger motion weights after motion relevant training
Experiment 2 • On the basis of consistencies between visual and haptic percepts, can observers learn two cue combination rules, and can they learn to apply each rule in its appropriate context? Example: Red texture elements: motion cue relevant Blue texture elements: texture cue relevant
Visual test: 7 out of 10 subjects have larger motion weights in the motion relevant context Motor test: 7 out of 10 subjects have larger motion weights in the motion relevant context
Experiment 3 • More naturalistic training task: • view cylinder • adjust thumb and index fingers to indicate depth • grasp cylinder • judge whether visual depth was less than, equal to, or greater than haptic depth (no feedback)
Visual test: 4 out of 4 subjects have larger motion weights after motion relevant training Motor test: 3 out of 4 subjects have larger motion weights after motion relevant training
Summary • Estimate cue reliabilities: Observers can use haptic percepts as a standard against which they can evaluate the relative reliabilities of available visual cues. • Learning: Observers can adapt their visual cue combination strategies on the basis of consistencies between visual and haptic percepts so as to place greater emphasis on depth information from visual cues which are consistent with haptic percepts.